
Reading key. M1 tests hauling. M2 adds the on-site construction workforce and its settlement burden. M3 is the model's current integrated project-population total: the included on-site and off-site labor burdens, together with the household and dependent populations assigned by the model. M3 is partial because some quantified material, supply, and physical-capability findings are governed separately and are not denominated in people. Integration Waves 1 through 6 identify successive workbook stages in which qualified operations were tested and, where appropriate, added to M2 or M3. They are development and audit-history labels, not proposed phases of Great Pyramid construction. Wave 2 is the village-sufficiency test; it tested a claimed source of internal services rather than adding a new labor block.
| Field | Current status |
|---|---|
| Status | Technical white paper accompanying QA_Integrated_Model_v0_92_USER_SOURCE.xlsx. The controlling audit is complete for the findings reported here. Additional modules remain open or outside M3. Those modules may add burden, but they do not suspend or reverse a returned finding unless its stated reversal condition is satisfied. |
| Integration status | Integrated into M3: shaping/setting labor (Wave 1), timber labor (Wave 3), ramp construction/maintenance/removal (Wave 4), the Aswan granite expedition (Wave 5, bodies only), and the river/harbor corridor (Wave 6, bodies only). Quantified but outside M3: sanitation/medical, processing/fuel/containers, the shaping/setting copper-tool diagnostic, and the material screens for timber, rope, and copper. |
| Controlling workbook | QA_Integrated_Model_v0_92_USER_SOURCE.xlsx, SHA-256 4c7191452c0f8bd9c8ade1259e52f53b7b52817d69dd624c0b1c53ea7981580e |
| Reconciled against | QA_Integrated_Model_v0_90_USER_SOURCE.xlsx. wp39's figures and values were reconciled to v0.90; v0.91 and v0.92 add text and provenance repairs that moved no reported value, so every figure here holds against the controlling workbook above. |
| Figures | The nine figures report values reconciled to workbook v0.92. Their underlying plotted values have not moved since v0.89. Six figures were graphically reconstructed for legibility without altering the data. DemographicClosure_46!B32 and B25 are identical at v0.89, v0.90, v0.91, and v0.92. |
| Supersedes | Working White Paper v3.8 (wp38, published 2 September 2026, built on workbook v0.91). |
| Purpose | Constructibility and logistics analysis. The audit determines capability; it does not identify the builder or prescribe a replacement construction method. It neither proposes nor excludes an earlier or otherwise unknown builder. That question lies outside the model's tested scope. |
| Core question | Does the conventional construction explanation close as a resource-loaded system when labor, materials, replacement, logistics, human support, and state capacity are loaded together? |
| Current result | The integrated audit determines that Old Kingdom Egypt did not possess the capability required to deliver the Great Pyramid. Multiple required operations fail independently. The combined labor, logistics, material, support, and state-capacity program also fails system closure. See the Executive Summary for both levels of failure. Version chronology is in Appendix C. |
Publication Information
First published: September 8, 2026
Version: 3.9 (wp39)
DOI for this edition: https://doi.org/10.5281/zenodo.22392247
Project website: https://quantifyingantiquity.com/
Public model: https://model.quantifyingantiquity.com/
This report is the controlling technical account of the Quantifying Antiquity system-closure audit. A shorter public-facing companion paper presents the principal findings for a general readership at https://doi.org/10.5281/zenodo.22390422.
Version status. For corrections, later versions, and the current status of this publication, use the Versions section of the Zenodo DOI record above.
Suggested citation. Quantifying Antiquity. 2026. Integrated Constructibility Audit of the Conventional Great Pyramid Construction Explanation. White Paper v3.9 (wp39). https://doi.org/10.5281/zenodo.22392247.
Copyright and license. Copyright © 2026 Quantifying Antiquity. Quantifying Antiquity is the publishing name of the author and an independent research project. This white paper is licensed under the Creative Commons Attribution-NoDerivatives 4.0 International License (CC BY-ND 4.0): https://creativecommons.org/licenses/by-nd/4.0/. Attribution should identify Quantifying Antiquity, the publication title, its version, and the DOI. Except where otherwise credited, the license applies to this white paper and its original figures. It does not apply to the protected workbook, model source code, private repository, checking software, project name, or branding.
Contents
1. Executive Summary
The integrated audit determines that Old Kingdom Egypt did not possess the capability required to deliver the Great Pyramid. Labor and settlement, timber supply, rope production, copper supply, and granite transport fail at separate governing limits. The combined construction program also fails when its operations and support systems are carried on one schedule against the same finite resources.
This white paper presents the model, evidence, assumptions, and reversal conditions behind that determination. It tests the conventional Great Pyramid construction explanation as one resource-loaded production system rather than as a set of isolated demonstrations. Many published construction analyses and demonstrations examine one major operation in isolation, such as moving a block, cutting stone, raising a beam, or transporting granite, and ask whether that operation can be demonstrated by itself. But no major operation stands alone. Each draws on shared workers, food, water, tools, materials, routes, workshops, transport capacity, and state organization. Each also creates work for the operations that supply, maintain, and sustain it. An operation that appears possible alone may become impossible when its requirements, dependencies, dependent operations, replacement demands, and secondary burdens are carried at the same time. This audit evaluates all of those relationships as one system. The model is detailed because each operation draws on shared workers, materials, routes, and support systems.
The current workbook version is v0.92. Its main integrated population result is the M3 project-population burden. M3 includes the labor and demographic burdens formally included in the integrated total; it is not a maximum containing every open module or every independent material and capability finding. New sheets and updates since v0.39 primarily strengthen control and diagnostic governance. They identify required functions, first-order exposure, source-control gaps, and integration-readiness gates. They do not silently reduce or inflate the main M3 result unless the associated burden has been included in Model_04.
| Findings integrated into M3; labor and demography | Value | Interpretation |
|---|---|---|
| Test 1 labor (ex-farmer numerator) | 54,105 | All priced departments minus annual-yield farmers; farmers are priced in Test 2 (Finding F24). |
| Non-farm male labor pool (1.6M) | 76,800 | The real pool for every male state function outside farming. |
| Project share of pool | 61.6% (concurrent / standing, MR-08) | 2.5x the 25% single-project mobilization ceiling. The pre-v0.81 rostered/standing figure of 70.4% mixed a 20-year flow into a single-moment stock and is retained as a transparency line. |
| Inclusive share (transparency line) | 130.8% | All rostered labor including project farmers; retained for transparency, not the reported Test 1 share. |
| Robustness at the sourced anchor | 61.6% at DEFAULT levers; 30 of 30 grid cells above the benchmark | No cell of the sourced 1.6M grid falls below the benchmark; its most extreme corner still returns 28.2% (a 30% prime-age share with 65% agrarian labor). Two cells fall below only in the 2.0M out-of-period stress test. Sec 9.1. |
| Sustained mobilization vs documented max | 0.95x the Weni levy (concurrent basis, DEFAULT mortality; 0.825-1.140x over the cemetery range) | Within five percent of the kingdom's largest recorded army, read at maximum, held continuously for 20-30 years against a levy raised once and disbanded, and exceeding it at the high-mortality end of the sourced range; Sec 9.2 (F25). |
| Cohort intake | 12.3% of every maturing male cohort | 2,705 additional prime-age men must enter the workforce each year of the build for the non-farm departments assigned to the Great Pyramid construction program. |
| Population footprint (secondary) | 533,234 on the published cumulative-roster basis; 403,746 in the MR-21 corrected-basis derivative | SECONDARY: includes dependents existing independently of project. The corrected derivative is recorded in the ruling, not in a live output cell. |
| Population share 1.6M | 33.33% | Secondary context only. |
| Secondary ratio vs 150k screen | 3.55x | Reference ratio only; the model does not rely on a single hard cutoff. |
| Water delivered, integrated | 3,388,287 L/day | Loaded in current M3; 19,960 active adult carriers and 34,695 rostered, of which 18,489 active carriers arise from the domestic and process feedback loop alone. Sec 7.2. |
| Food, headline method | 45,282 grain farmers; 226,410 with dependents | Direct-cropland lower bound, the M3 headline. The feedback-solved farmer-household loop is published as the named ceiling at ~1,603,797 project-dedicated people, 100.2% of the 1.6M anchor. Sec 7.3. |
| Settlement overshoot (a workforce ratio) | 11.27x on the published cumulative-roster basis; 8.35x in the MR-21 corrected-basis derivative | The published on-site roster is 11.27 times the 4,200-worker conventional-baseline workforce; arithmetically identical to "281,643 implied village vs the 25,000 screen", because the ceiling cancels (MR-22). The measured re-basing derivative lowers the ratio to 8.35x without changing the finding. M2 result. Sec 5, Sec 8, Sec 11. |
| Diagnostic governance status | v0.82 matrix reconciled | Diagnostic modules are rolled up in DiagnosticIntegration_35 with per-module status; partially integrated modules (labor in M3, material or tool diagnostic outside) are recorded as such and are not additive headline totals. |
The table above reports what the M3 population total expresses. It is not the whole result. The model also returns material and capability findings that the M3 total cannot express, because they are denominated in tonnes, cubic meters, voyages, bearing pressure, and deck movement rather than in people. Parts of their labor chains are already carried in M3, including rope plant and fiber labor, the quarry copper chain, timber labor, the granite expedition, and river/harbor bodies; but the physical findings themselves are not represented by a population figure. They are reported here at the same level, with their status stated.
These findings are governed by separate evidence, quantities, and physical thresholds. Some share upstream resources: copper smelting and timber draw on the same woodland, rope production creates farm and labor burdens, and granite operations require timber, vessels, and harbor support. The demands are connected even where the ceilings are not. What none of them shares is a population denominator. None is removed by increasing the size of the kingdom.
| Independent material and capability findings not expressed by the M3 population total | Value | Status and interpretation |
|---|---|---|
| Timber throughput vs the largest documented import | 1.50x annually; 30.09x over the build | Snefru-ship equivalents of total timber throughput. Literal imported cedar under the model's own 50% native concession is 0.75x annually and 15.05x over the build. Material screen control-only; labor integrated into M3. Sec 10.2 (F27). |
| Copper demand vs the largest known Sinai source | 7.16x the Bir Nasib long-run annual average | One build draws 11.01% of that site's entire all-time output; about 143 years of production at its average rate. Quarry tool-chain labor is carried in M3; the supply chain and its woodland footprint are diagnostics. Sec 7.10 (F31). |
| Rope replacement, annual | 567.2 t/yr = 17.45 first-rate riggings a year | One complete first-rate warship rigging every 2.98 weeks for the whole build, against a sourced per-ship rope requirement. Plant and fiber labor are carried in M3; the material chain is a diagnostic. Sec 7.9 (F30). |
| Granite shore transfer, bearing pressure | Break-even at 5.33 m2 lifting footprint | Capability gap stated as a threshold: the finding holds for any footprint below the break-even, which is 44% of the beam's own bearing face. Sec 10.1 (F28). |
| Granite transfer stability | 0.41 m deck-edge drop; 4.10x tolerance | Capability gap. Break-even waterplane is 3,200 m2, requiring a 246 m hull, against a largest attested vessel of 1,323 m2. Identical for end- and side-loading. Sec 10.1 (F29). |
The failures are simultaneous, not alternatives. A demographic concession, such as a larger population, a higher prime-age share, or a lower agrarian share, is denominated in people, and only the labor findings are. It does not touch any of the material or capability findings, because none of them is denominated in people. A rescue must clear every row below, not one.
| Failure | Denominated in | Does a demographic rescue touch it? | What a rescue must supply |
|---|---|---|---|
| Sustained non-farm mobilization | share of a labor pool | Yes; the only one it touches | A sourced Old Kingdom demographic configuration producing a sufficient pool, not a grid corner assembled from three simultaneous favorable extremes. |
| Mobilization vs the documented levy | people held continuously | Partially | Evidence of a state holding levy-scale mobilization continuously for decades rather than episodically. |
| Timber delivery | cubic meters and voyages | No | A delivery mechanism at the required rate, or a sourced reduction in the requirement. More people do not create more cedar or more hulls. |
| Copper supply | tonnes of metal | No | An ore and smelting source at the required scale. More people do not create more ore. |
| Rope and fiber | tonnes and cropland | No | A fiber supply and production capacity at the required rate, or a lower rope consumption rate. |
| Granite shore transfer | bearing pressure | No | A lifting mechanism with a ground contact footprint above the break-even, or a prepared bearing surface. |
| Granite transfer stability | deck movement in meters | No | A hull with waterplane above the break-even, or a loading method that does not require the beam to cross a moving deck edge. |
| Barge refloat | physical mechanism | No | An attested method for refloating a laden hull from floodplain ground. |
| Settlement capacity | excavated evidence | No | Excavated accommodation at the required scale. |
The integrated audit determines that Old Kingdom Egypt did not possess the capability required to deliver the Great Pyramid. This determination is returned across multiple independent operations and again at full-system closure. The audit does not identify the builder. It neither proposes nor excludes an earlier or otherwise unknown builder.
The conclusion rests on four independent comparisons: the non-farm male labor pool, the maximum documented Old Kingdom levy, agricultural surplus, and settlement capacity. Those ceilings come from unrelated evidence bases: demographic synthesis, a 6th-Dynasty inscription, cropland and yield data, and excavated footprint; so no single source failure takes down more than one of them. The demands tested against them are not independent in the same way. They are functions of the project roster and of the schedule, and they move together: a reviewer who reduces the roster moves every front at once. The falsifiability statement identifies the evidence or mechanism required to reverse each finding.
2. Purpose and Scope
The purpose of the model is to test constructibility. The audit determines capability; it does not identify the builder or prescribe a replacement construction method. It neither proposes nor excludes an earlier or otherwise unknown builder. It tests whether the conventional explanation can satisfy its own required functions without double-spending labor, grain, water, timber, rope, copper, land output, transport capacity, or administrative support.
Constructibility is not a modern convention. In any era, every required operation must be performed with the labor, materials, energy, transport, space, time, and support actually available. Modern program controls do not create these dependencies; they make them explicit and prevent them from being evaluated in isolation. The full work breakdown structure must therefore be resource-loaded, sequenced, supported, and sustained.
The scope of the current paper includes hauled-stone cadence, water logistics, route capacity, quarrying, rope/fiber, copper/tools, food, kingdom capacity, universal human requirements, water feedback, youth light support, water-infrastructure alternatives, food feedback, sanitation/medical control, processing/fuel/container control, timber-system control, ramp-system control, and shaping/setting/casing control. Shaping/setting/casing, timber labor, ramp systems, the Aswan granite expedition, and the river/harbor corridor are integrated into the headline M3 total as Waves 1, 3, 4, 5 and 6. The last two carry bodies only, without resident families. Sanitation and medical support, and processing, fuel and containers, remain quantified diagnostics outside M3 until their integration-readiness gates are satisfied.
3. Methodology and Definitions
Why a Resource-Loaded Program Model Is Required
The conventional construction explanation commonly invokes ramps, sledges, ropes, corvee labor, skilled organization, and state capacity. Those are not complete models. They are components of a model. The constructibility question is whether all required components can operate together at the required production cadence without exceeding the available labor, material, replacement, logistics, and support capacity.
In program-controls terms, the pyramid build must be treated as a resource-loaded WBS. Direct work crews create indirect work. Indirect work creates households, water, food, replacement, sanitation, containers, storage, tools, supervisors, and administration. A burden cannot be deleted unless the function it performs is reassigned to another mechanism and cost-loaded.
Conventional Baseline
The conventional baseline is the conventional explanation's stated 30-year, around-the-clock build, evaluated against this model's 3,000-man reference labor pool at entry age 20. The reference pool is a rounded assumption set in the conventional account's favor, not a sourced figure. Under the entry-age-15 concession, it scales to the 4,200 effective workforce used in the settlement test. Dividing the 25,000-person settlement screen by 4,200 yields the 5.9524 baseline village-population ratio used in Section 8.1.
System Closure
System closure means that every necessary function is assigned a feasible mechanism, and every mechanism is assigned its labor, material, replacement, support, and feedback burden. A system does not close if it satisfies the visible construction task while leaving required support functions unpriced.
Material Balance
Material balance means the same output cannot be spent twice. Grain assigned to project workers cannot simultaneously feed the non-project economy. Timber assigned to fuel cannot simultaneously serve as sled runners, planking, levers, cribbing, anchors, or boats. Rope assigned to active hauling cannot simultaneously satisfy replacement, handling, anchor, and staging demands unless those demands are separately loaded.
Off-site production may be geographically dispersed, but it is not economically free when its output is required by the pyramid. The model therefore treats project-dedicated grain, fiber, copper, timber, rope, fuel, pottery, containers, boats, animals, and labor as committed capacity. Moving a burden off-site changes where it is paid; it does not remove the burden. The audit asks whether the kingdom-level system can absorb that payment while continuing to feed, water, equip, defend, administer, and operate the rest of the economy.
Required-Function Audit
The model uses a required-function audit. If a critic reduces a burden, the associated function remains. The model therefore asks what replacement mechanism, productivity change, schedule change, scope reduction, or source-supported assumption carries that function instead.
Scenario Receipts and Reproducible Scenario Checking
Where independently published source code and datasets are available, they permit examination of the corresponding bounded source inputs. The controlling workbook for this project is protected intellectual property and is not distributed. The verification claim made here is therefore narrower: readers can check a scenario by re-running it on the public model, but they cannot independently reconstruct or recompute the workbook.
The public model at https://model.quantifyingantiquity.com/ exposes the principal load-bearing controls used in the audit. A reader can change those controls, run the model, and export a scenario receipt: a readable document recording
- the resolved assumptions and the baseline values they replaced;
- the headline closure results and every registered output that changed, with its baseline and scenario value;
- the workbook version and SHA-256, baseline tag, engine package and commit, and target-registry version;
- the source register supporting the inputs; and
- the generation time.
Each receipt contains a scenario_digest, calculated as the SHA-256 of a canonical serialization of its technical scenario content. That content includes the resolved inputs, results, scenario explanation, sources, and workbook and engine identifiers. The encoding, key order, separators, and number treatment are stated inside the receipt. A reference checking script is included among the supporting files archived with this report at https://doi.org/10.5281/zenodo.22392247. Re-running the same resolved inputs on the same released model produces the same digest, allowing a reviewer to compare a reported scenario with a fresh run.
The generation time, the digest itself, receipt-format and serialization metadata, the DOI, filenames, display mode, and raw submitted text are excluded from scenario_digest. These exclusions keep publication or presentation metadata from giving an unchanged scenario a new identity. Raw submitted text is excluded because the digest identifies the scenario the model ran, not whether the same values arrived through a form or a shared link.
Each receipt is downloaded with a separate .sha256 file covering every byte of that particular receipt, including its generation time. The checksum is separate because a file cannot contain a checksum of itself. It detects alteration of one download; it is not the reproducible scenario identity.
Neither hash establishes provenance. They are generated without a secret, so anyone can edit a receipt and calculate consistent new hashes. The baseline receipt and its whole-file checksum released with this edition are deposited with this report at https://doi.org/10.5281/zenodo.22392247. A reader can therefore confirm that a copy matches the independently timestamped deposit. The additional assurance comes from the Zenodo record, not from the hash alone.
The digest covers the workbook and engine identifiers and is therefore specific to the release that produced it. A later model release correctly produces a different digest. The receipt provides reproducible scenario checking and visibility into every registered output that moved; it does not substitute for publication of the workbook or permit independent recomputation of its implementation.
4. Model Architecture
The workbook is organized as an integrated model plus control layers, diagnostic modules, source-control tracking, and an integration-decision roll-up. Model_04 carries the current headline partial M3 result. Later sheets identify open functions, feedback risks, source gaps, and future integration gates. This prevents open diagnostic burdens from being mistaken for included totals.
| Workbook layer | Current status | Purpose |
|---|---|---|
| Model_04 | Integrated partial M3 | Main live calculation engine for current headline population and key operating assumptions. |
| WorkforceLedger_05 | Integrated | Active labor, rostered labor, and household/population separation. |
| RouteCapacity_12 | Integrated / partial | Route, lane, cadence, and track-wetting support checks. |
| FoodSystem_13 | Integrated / lower-bound partial | Grain, cropland, food production, and food-processing capacity checks. |
| HumanRequirements_20 / WaterFeedback_21 | Integrated for water when toggle is YES | Algebraic domestic/process water feedback and carrier-village population loop. |
| YouthLightSupport_26 | Integrated as bounded credit | 5% intermittent youth light-support credit against adult-carried village domestic/process water only. |
| WaterInfraAlt_27 | Control only | Replacement-system gate for canals, depots, wells, animals, storage, boats, or other water-delivery claims. |
| FoodFeedback_28 | Method ruled / named ceiling | Direct-cropland lower-bound remains the M3 headline; the feedback-solved farmer-household loop is published as the named ceiling (Section 7.3). |
| SanitationMedical_29 | First-order diagnostic | Waste handling, cleaning, and basic medical support diagnostic. |
| ProcessingFuelContainers_30 | First-order diagnostic / non-additive risk | Processing labor, fuel handling, container circulation, reserve, and replacement diagnostic. |
| ShapingSetting_33 | Integrated (Wave 1) | Final shaping, setting, casing, copper-tool wear, timber support, and rework exposure with readiness gate. |
| TimberSystem_31 | Material screen control-only; labor integrated via TimberLabor_40 (Wave 3) | Structural timber active stock, replacement, gross timber, and service-life sensitivity screens. |
| RampSystem_32 | Integrated (Wave 4) | Ramp body material, construction, maintenance, traffic/staging, and removal/rework screens. |
| CitationControl_34 | Source-control layer | Flags load-bearing source gaps, page/table tasks, and internal model-control rules. |
| DiagnosticIntegration_35 | Governance / roll-up layer | Summarizes diagnostic modules, first-order exposure, M3 readiness, and non-additive controls. |
| GraniteAswan_42 / BargeTimber_43 | Integrated (Wave 5, bodies only) | Aswan expedition corps, barge-fleet sizing, and felled-acacia feed into the timber labor chain. |
| DemographicClosure_46 | Verdict layer (v0.61) | Sustained-mobilization test against the kingdom's maximum documented capacity; adds no burden to M3. |
| RiverHarbor_47 | Integrated (Wave 6, bodies only) | Barge crews, harbor gangs, and pilotage for the Aswan granite corridor, Merer-anchored. |
5. Current Audit Results
| Metric | Current value | Notes |
|---|---|---|
| Hauling rostered labor vs adjusted effective labor pool | 8,761 | Case C hauling alone remains above the adjusted effective labor pool. |
| On-site rostered labor, six priced departments | 47,316 | Haulage + water + rope plant + quarry + shaping/setting + ramp. |
| Implied on-site village population | 281,643 | Village ratio applied to on-site rostered burden. |
| Current M3 project-dedicated population | 533,234 published basis; 403,746 corrected-basis derivative | The published figure includes implied village and off-site support households. The derivative is recorded in MR-21 rather than a live output cell. |
| Share of 1.6M Old Kingdom population (standard anchor) | 33.33% | Standard scholarly anchor (Butzer); higher-estimate sensitivity in workbook. |
| Settlement overshoot | 11.27x published basis; 8.35x corrected-basis derivative | Both compare the required on-site workforce with the 4,200-worker screen. The finding survives re-basing (MR-21). |
| Copper demand multiple of Bir Nasib all-time average | 7.16x | Supply-chain burden check. |
| Share of Bir Nasib all-time output consumed by one build | 11.01% | Supply-chain burden check. |
The published cumulative-basis headline of 533,234 exceeds the highest mobilization-capacity band, the 500,000-person band labeled kingdom-scale reorganization, before several additive functions are integrated. The MR-21 corrected-basis derivative is 403,746, below that band, but the governing national-closure, demographic-closure, and settlement findings all survive because they are controlled by labor, cohort, and workforce comparisons rather than this secondary population band. Open modules can add burden if included in M3. A proposed alternative can reduce a specific burden only if its replacement functions are identified, quantified, and cost-loaded.
Reporting convention: headline values are live workbook outputs. In prose they are reported to three significant figures; exact values remain in the tables and the workbook to preserve traceability without implying false precision.
The conventional construction account fails at two levels. Several required operations exceed their own governing physical, material, or capacity limits before integration. The combined program then fails again when shared labor, logistics, materials, support systems, and state capacity are loaded onto one concurrent schedule. The labor and settlement ladder is:
| Model level | Result | Status |
|---|---|---|
| M1; Hauling only | 8,761 rostered vs 4,200 effective pool | Does not close. |
| M2; Construction core | 47,316 on-site rostered against a 4,200 effective pool; 11.27x; implied village 281,643 | Does not close on labor. The settlement figure is the same ratio restated (MR-22). |
| M3; Integrated (partial) | 533,234 project-dedicated population | Does not close against mobilization-capacity bands. |
This ladder measures labor and settlement integration only. It is not the whole failure surface: the material and capability findings listed in the Executive Summary sit outside M3 by design and are reported in Sections 7.9, 7.10, 10.1 and 10.2. The ladder reports the labor result; it does not contain five independent findings that no change to the roster would resolve.
The 25,000 settlement ceiling in M2 is set generously. It was re-badged as an assumption in v0.64 and remains so in v0.92. It sits at the top of the published workforce range, well above the published excavated-capacity arithmetic for the worker town itself (Lehner 2002; Lehner 2015).
Draft v3.4 added that a smaller, excavation-based ceiling only worsens the M2 failure. That claim is withdrawn (ruling MR-22.) It was not merely backward; as written it referred to a quantity that does not move. The 25,000 figure is both the numerator of the village ratio and the capacity that ratio's product is compared against, so it cancels. The implied village is the on-site rostered roster multiplied by the conventional-baseline ratio of 5.9524; 25,000 divided by that same ratio is the 4,200 adjusted effective labor pool, and the overshoot therefore reduces to on-site roster divided by 4,200: 47,316 / 4,200 = 11.27, which does not move with the ceiling at all. What does move with the ceiling is the implied village population and, through it, the headline: both fall in direct proportion as the ceiling falls. A smaller, excavation-based ceiling therefore lowers the reported burden. The direction has been measured at a reduced ceiling and runs that way; the magnitudes are scratch derivatives rather than v0.92 cells and are not stated as model output. Every verdict survives the change. The 25,000 figure remains a steelman by construction, but the generosity sits in the population it licenses, not in the ratio.
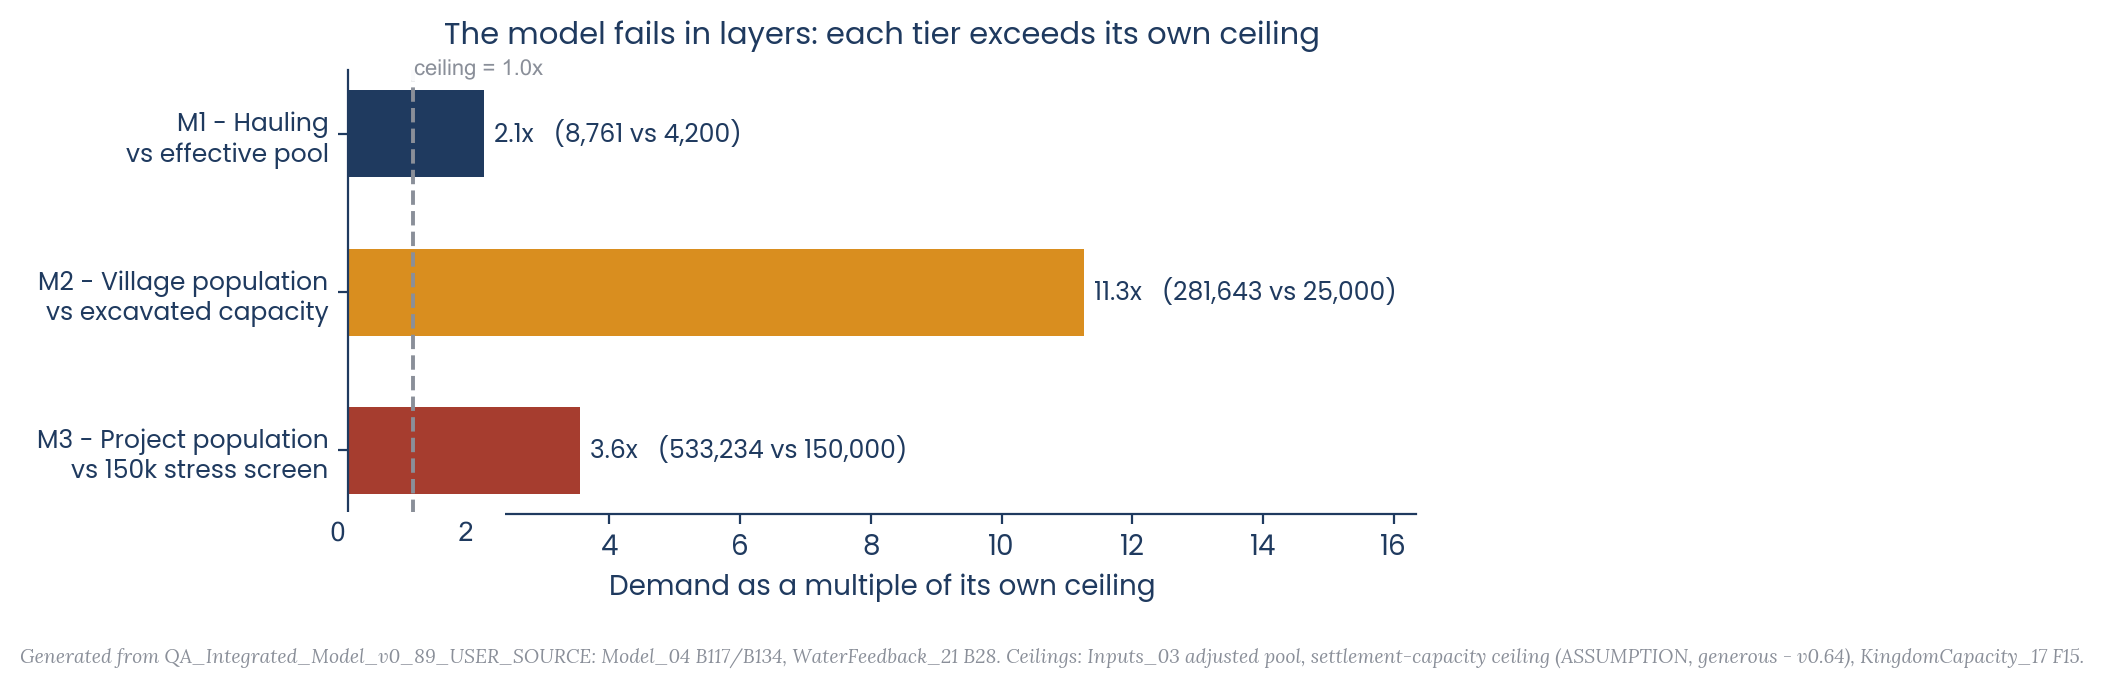
Figure 1. Each labor-and-settlement tier exceeds its assigned comparison before additional burdens are added. All values are reconciled to the v0.92 workbook. Populations shown are cumulative counts across the build, not standing populations.
6. Model Mode, Integration Rules, and Burden Maturity
M3 is the current integrated population ledger, not the entire audit. It contains included labor and demographic burdens; separately governed material and capability findings remain outside that population total. Open additive modules may increase the M3 burden but do not suspend or reverse a finding already returned. Water has been moved beyond a first-order diagnostic by solving the carrier-village feedback loop. Food is now a ruled method pair: the main M3 direct-cropland lower-bound is the headline, and the feedback-solved farmer-household loop is published as the named ceiling (Section 7.3). Sanitation/medical support and processing/fuel/containers remain controlled/open unless and until their integration gates are satisfied; shaping/setting/casing (Wave 1), timber labor (Wave 3), ramp systems (Wave 4), the Aswan granite expedition (Wave 5, bodies only), and the river/harbor corridor (Wave 6, bodies only) are integrated.
| Rule | Application |
|---|---|
| No silent burden deletion | A reduction in carriers, labor, timber, water, food, or material requires a replacement mechanism or changed productivity/schedule/scope assumption. |
| No double-spending | Fuel wood, structural timber, labor, rope, grain, containers, and land output cannot satisfy two independent burdens unless separately sized. |
| No direct-labor-only additions | Future operations must be human-loaded and feedback-checked before entering M3. |
| Diagnostics are not headline totals | Control sheets may show first-order impact, but the main result does not change until the burden is included in Model_04. |
| Diagnostic roll-up is not additive | DiagnosticIntegration_35 prevents first-order diagnostic burdens from being stacked into a new headline total before readiness gates, double-count controls, and feedback treatment are resolved. |
7. Operation Modules and Support Layers
7.1 Cadence and Haulage
The Case C desert-honest scenario requires a 205.7-block/day cadence, approximately 63 simultaneous haul teams, and approximately 55 blocks in tow simultaneously. These values set a traffic and route-capacity burden that any ramp or route solution must support.
| Haulage metric | Case C value |
|---|---|
| Blocks per 24 hours | 205.7 |
| Teams required to hold cadence | 63 |
| Blocks in tow simultaneously | 55.0 |
| Track-wetting water already priced | 144,000 L/day |
7.2 Water Feedback, Youth Light Support, and Water Alternatives
Water is the most mature feedback layer in the current workbook. Domestic/process water was integrated because the previous model could not simply add village water as a one-step load. More village water requires more carriers; more carriers increase rostered workers; more rostered workers increase implied village population, and that larger village requires more water. WaterFeedback_21 solves this loop algebraically.
| Water metric | Current value | Treatment |
|---|---|---|
| Integrated Giza-delivered water | 3,388,287 L/day | Loaded in current M3 water treatment. |
| Domestic/process water dispatched incl. loss | 2,964,662 L/day | Volume remains required even if delivery method changes. |
| Base active carriers before domestic/process feedback | 1,471 | Pre-feedback baseline. |
| Current active adult water carriers | 19,960 | After water feedback and 5% youth light-support credit. |
| Incremental active carriers from domestic/process water | 18,489 | Main reducible burden if a replacement water-delivery system is cost-loaded. |
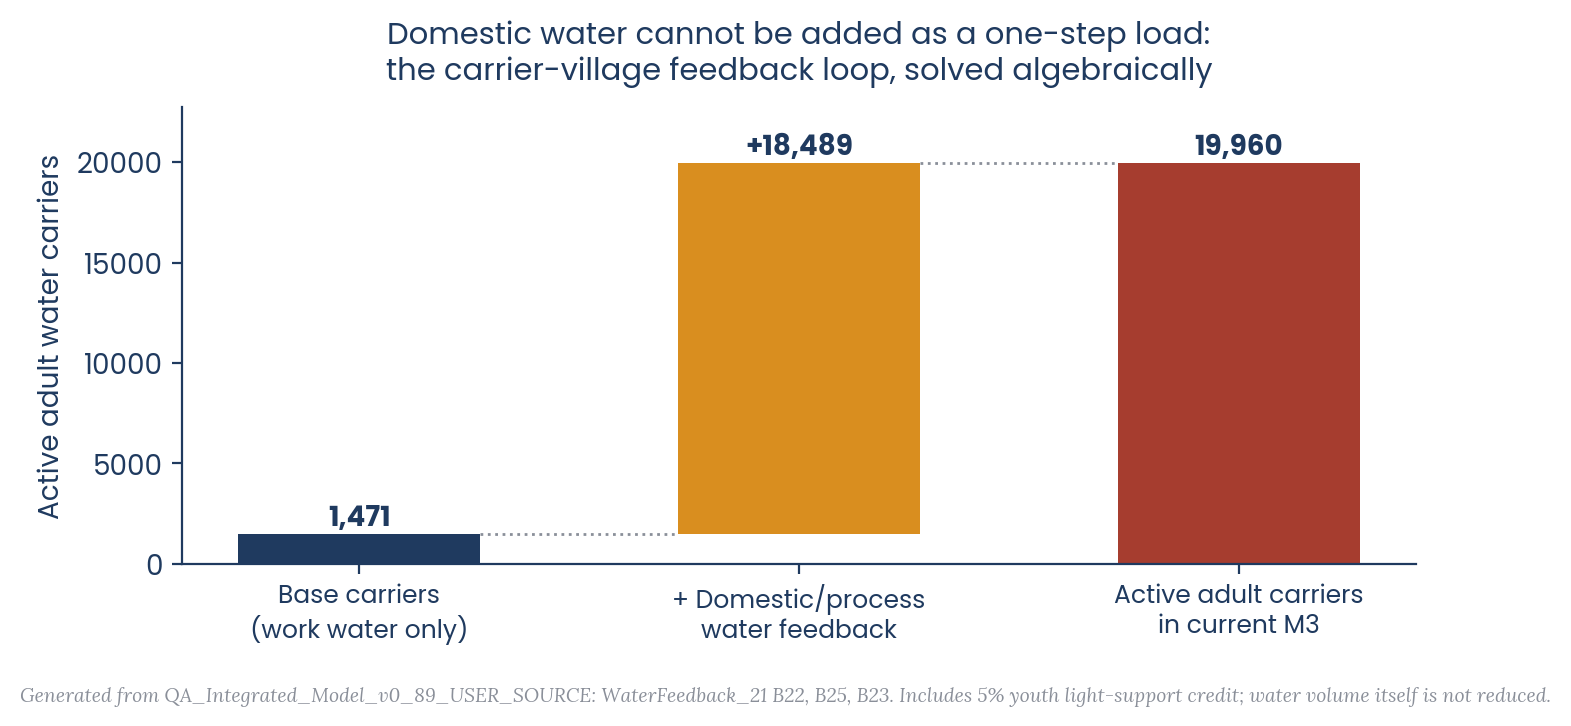
Figure 2. The carrier-village feedback loop: adding domestic/process water multiplies the carrier department roughly thirteenfold once the loop is solved rather than stacked.
YouthLightSupport_26 applies a bounded 5% intermittent youth light-support credit only to adult-carried village domestic/process water burden. This recognizes that older children likely helped with light tasks at times, but it does not turn children into a continuous adult-equivalent labor department and does not reduce the water volume required.
WaterInfraAlt_27 preserves the fair criticism that water may not have been entirely hand-carried. The model does not reject that possibility. It requires the replacement system to be quantified: depots, canals, wells, cisterns, animals, sled tanks, boats, or permanent water infrastructure must carry their own labor, material, maintenance, feedback, and evidence burden before they reduce the main M3 carrier total.
7.3 Food System and Food Feedback
The food method is now ruled rather than forked. FoodSystem_13 remains integrated as the direct-cropland lower-bound, and that lower-bound stays the headline M3 method. FoodFeedback_28's feedback-solved farmer-household loop is no longer an unresolved sensitivity fork: it is published as the named ceiling of the food system. The two methods bracket the food burden. The headline is the least the food system can cost; the named ceiling is what it costs once producer households are solved through the surplus loop. v0.38 corrected grain and fiber farmers to a roster factor of 1.0 because annual crop yield already embeds the agricultural calendar. Standing facility, transport, retting, fiber prep, water, quarry, copper, rope, ramp, and other continuous project-service crews retain the full roster/replacement multiplier.
| Food-feedback diagnostic | Current value | Result |
|---|---|---|
| Gross grain output per active farmer | 1.80 t/yr | Current input. |
| Gross food required per active farmer household | 1.47 t/yr | Corrected farmer-household requirement; no construction-crew roster multiplier. |
| Net surplus per active farmer after own household support | +0.33 t/yr | Positive under corrected annual-yield treatment. |
| Implied net surplus share | 18.07% | Net surplus divided by gross output. |
| Food feedback status | PASS / CONTROL | Annual-yield farmer loop generates surplus; full project food-method choice remains open. |
| Feedback-solved total, FoodFeedback_28!B54 | 1,603,797 people | Live v0.92 sheet value on the corrected household and concurrent bases. The loop was introduced across v0.83-v0.84; MR-19 restored the rostered basis in v0.88. Rations are carried at five per household. Its off-site basis predates Waves 3-6 and the reconciliation below remains an open model task (DERIVED). |
| Named ceiling reported in this paper | ~1,603,797 people | The sheet value; the earlier hand-reconciled 880,308 was a v0.82 figure and is superseded. A live Waves 3-6 reconciliation is an open workbook item (DERIVED). |
| Named ceiling as share of the 1.6M kingdom | 100.2% | Ceiling method only; the headline M3 remains the direct-cropland lower-bound (DERIVED). |
The food diagnostic is still important because off-site production is not free. If the pyramid requires the output, that production capacity is project-dedicated. The same grain cannot feed the pyramid workforce, feed farm households, serve as seed/storage reserve, and remain fully available to the non-project economy.
7.4 Sanitation, Waste, and Basic Medical Support
SanitationMedical_29 is a first-order control layer. It does not add a new water demand, because the current water model already includes a hygiene/sanitation water allowance. It exposes the missing labor/function side: latrines, waste handling, cleaning, refuse control, and basic injury care.
| Sanitation / medical diagnostic | Current first-order result | Integration status |
|---|---|---|
| Combined support workers | 1,128 active / 1,961 rostered | Diagnostic only. |
| Population if integrated before feedback | 9,803 | Not included in M3. Full feedback would be required first. |
| Treatment | Control layer | Labor, materials, and support feedback remain open. |
7.5 Processing, Fuel, and Containers
ProcessingFuelContainers_30 exposes the fact that grain, water, and fuel are not useful merely because they exist. They must be milled, baked, brewed, stored, distributed, carried, contained, cleaned, repaired, and replaced. FoodSystem_13 already had some food-processing math, but the new control layer isolates container circulation and replacement logic.
| Processing/fuel/container diagnostic | Current value | Integration note |
|---|---|---|
| Food-processing labor total | 24,171 active | Capacity check/control layer, not added as a new department. |
| Processing share of current on-site rostered workers | 51.08% | High share; must not be double-counted as both background household labor and standing department. |
| First-order M3 if processing labor were added as new department | 743,300 people | Diagnostic only; not included in Model_04. |
| Integrated Giza water needing containers | 3,388,287 L/day | Container circulation must be compatible with water system. |
| Minimum daily utility containers in circulation | 79,089 | One full annual turnover implies 79,089 replacements/year. |
7.6 Timber System
TimberSystem_31 is now a quantified structural-stock and replacement diagnostic. It screens active structural timber stock, annual replacement, gross timber before conversion/reject/handling losses, and cumulative 20-year gross timber demand. The material-stock screen remains control-only, but the labor it implies is converted and integrated into M3 off-site via TimberLabor_40 (Wave 3). Species/grade/dimensions, service life by use class, boat/harbor recursion, and feedback effects remain open levers on the screen.
This table covers the general structural stream only: sledges, levers, cribbing, anchors, ordinary boats, and workshops. It excludes edge-ramp planking (Section 7.13) and the dedicated granite barge fleet. Those streams are carried separately in the all-streams accounting below; the two tables are not competing estimates of the same quantity.
| Timber diagnostic item (structural stream only) | Base result |
|---|---|
| Base active structural timber stock screen | 292.7 m3 |
| Usable replacement timber per year (installed basis) | 292.7 m3/yr |
| Gross timber before losses (felled basis) | 667.2 m3/yr |
| Cumulative gross over 20-year build (felled basis) | 13,343.7 m3 |
| Multiple of 2,745 m3 cedar comparator, felled basis, structural stream only | 4.86x |
| M3 readiness | Material screen control-only; labor integrated (Wave 3) |
The all-streams rollup is carried in TimberLabor_40!B7 and is the figure that governs Finding F27:
| All-streams timber demand (felled basis) | Base result |
|---|---|
| Structural stream (TimberSystem_31!B37) | 667.2 m3/yr |
| Edge-ramp planking (IERRampTimber_38!B31) | 3,463.3 m3/yr |
| Total timber per year (TimberLabor_40!B7) | 4,130.5 m3/yr |
| Cumulative over 20-year build | 82,609.5 m3 |
| Multiple of 2,745 m3 cedar comparator, all streams | 30.09x |
| Barge hull timber, carried separately (TimberLabor_40!B8) | 80.6 m3/yr; excluded from the rollup above, which is conservative |
7.7 Ramp System
RampSystem_32 is now an expanded material, traffic, maintenance, and removal diagnostic. It screens ramp body volume, material mass, construction man-days, annual maintenance, removal/rework, traffic/staging crew, and diagnostic population. The construction, maintenance, and removal crew is integrated into M3 (Wave 4) at the restored base parameters; surface-replacement treatment, traffic-model detail, and final-access/removal phasing remain open levers.
| Ramp-system diagnostic | Base value | Status |
|---|---|---|
| Ramp body volume | 250,000 m3 | Diagnostic screen only. |
| Ramp body material mass | 450,000 t | Material burden screen. |
| Construction man-days | 125,000 | Productivity/source basis remains open. |
| Annual maintenance volume | 25,000 m3/yr | Surface/route maintenance screen. |
| Removal/rework volume | 62,500 m3 | Final-access/removal/rework screen. |
| Traffic/staging active crew proxy | 12.6 active workers | Traffic-control proxy only. |
| Base diagnostic active crew | 108.1 active workers | Integrated (Wave 4): 188 rostered in M3. |
| Diagnostic population (integrated) | 1,118 people | Enters M3 through the village ratio. |
| Total material handled over build | 1,062,500 m3 / 1,912,500 t | Construction + maintenance + removal/rework screen. |
| M3 readiness | INTEGRATED (Wave 4) | Surface replacement, traffic detail, and removal phasing remain open levers. |
7.8 Quarrying and Route Capacity
Quarrying is priced from the block schedule rather than asserted. At the modeled cadence the quarry face releases 342.4 cubic meters of rock a day net of spoil (Model_04!B40), 787.5 tonnes by mass (B41), which requires 1,152 extraction crew (B42), 206 rough-dressing masons (B43), and 136 tool-support workers keeping copper edges sharpened and annealed (B44), producing a quarry department of 1,609 (B45). The extraction rate rests on the NOVA quarry trial (Inputs_03!B52, SOURCED), scaled for block geometry and for copper rather than iron tools; both scale factors are exposed assumptions and the copper-versus-iron factor carries a published sensitivity band.
Route capacity is identified and not priced. The model prices ramp construction, maintenance and removal (Section 7.7) and the haul cadence (Section 7.1), but it does not carry a separate route-capacity constraint; queueing, passing, headway, and the interaction of simultaneous traffic on shared lanes. That omission runs in the conventional account's favor: a route capacity constraint can only raise labor or extend schedule, never reduce either. It is stated here rather than left to be discovered.
7.9 Rope and Fiber
Rope is a consumable, not a fixture, and the model treats it as one. The hauling configuration requires 13,230 meters of rope in active service (Model_04!B88), rising to 15,214.5 meters once staged replacement stock is carried (B89). Under the service-life lever that stock is consumed and replaced continuously: 2,173.5 meters a day consumed (B90), 2,390.85 meters a day produced once production waste is included (B91), which is 872.7 kilometers a year (B93) and 567.2 tonnes of finished rope a year (B94). Over the build the requirement is 11,344.6 tonnes (B95).
Two comparators are carried, and they are not equally supported. The stronger one is the sourced one: at roughly 50 kilometers of rope per first-rate warship including rigging (Inputs_03!B39, SOURCED), the annual output is equivalent to completely rigging 17.45 first-rate sailing ships a year (Model_04!B96); one every 2.98 weeks (B97), every week of every year of the build. The second comparator sets the same output against a hand-era royal rope yard: 1.42 Chatham-class yards (B98), and 389 ropewalk workers at Chatham productivity (B99). Both Chatham figures rest on assumptions rather than pinned sources; the yard's estimated output (Inputs_03!B38) and its 1798 workforce (Inputs_03!B36), the latter registered as SRC-ROPE-CHATHAM with its primary attribution explicitly unverified and a citation task open. The first-rate comparison is the one to rely on; the Chatham pair is reported for scale and badged accordingly.
The chain then runs upstream into land and people. Producing 567.2 tonnes of rope a year requires 667.3 tonnes of prepared fiber (Model_04!B100), 2,224.4 tonnes of raw plant harvest (B101), 1,601.6 hectares of dedicated fiber cropland (B102), and 1,068 fiber farmers (B103), alongside 458 fiber-preparation workers for retting, beating and combing (B104) and 50 fiber-transport workers. The rope department totals 1,915 active people (B105). Once roster coverage and off-site households are applied, the rope plant carries 677 rostered workers and the fiber chain adds 1,952 rostered off-site workers, with a project-dedicated off-site population of 9,760. Those burdens are already carried in the integrated workforce and population ledgers. This section reports a chain that is priced, not a new one.
The assumption depth is uneven across the chain. The rope-in-service figure derives from the hauling configuration and is close to the sourced end. The cropland and farmer figures sit at the far end of eight assumptions applied in series: service life, production waste, rope mass per meter, fiber-to-rope yield, fiber extraction fraction, usable yield per hectare, land overhead, and hectares per farmer (Inputs_03!B34, B45, B35, B40, B41, B42, B43, B44). Each is set generous to the conventional account, but a figure eight assumptions deep should not be read at the same confidence as one that is two. The rope tonnage is the robust finding; the fiber estate is a sized consequence of it.
7.10 Copper and Tools
Copper is where a wear rate becomes a forest. The quarry's copper-tool users number 1,358 (Model_04!B48). At the modeled net loss per cutter-day the project loses 67.9 kilograms of copper a day (B49), 24.78 tonnes a year (B50), and requires 27.54 tonnes of new copper production a year once supply-chain losses are added (B51), against a circulating tool inventory of only 3.40 tonnes (B52). Over the build that is 550.7 tonnes of copper.
Against the sourced comparator that figure is the finding. Bir Nasib is the largest known Sinai copper source used here as the comparator, with documented Old Kingdom activity, and an all-time output of roughly 5,000 tonnes (Inputs_03!B79, SOURCED) over its entire working life. The project's annual demand is 7.16 times that site's long-run average annual output (Model_04!B65), and one build consumes 11.01% of everything Bir Nasib ever produced (B66), the equivalent of about 143 years of production at its average rate, compressed into twenty.
The upstream chain is the part the conventional account does not price. At the modeled Sinai ore grade, 27.54 tonnes of copper a year requires 344.2 tonnes of ore mined annually (Model_04!B53), 70 miners working Sinai under the same human factors applied everywhere else in this model (B54), and 70 more people in expedition overhead; soldiers, administration, camp (B55). Smelting requires 413.1 tonnes of charcoal a year (B56), which requires 2,753.7 tonnes of wood a year (B57). At the modeled sustainable yield, and with only half the woodland available to smelting, that is 11,014.9 hectares of woodland under sustained-yield management (B59), a footprint of 110.1 square kilometers (B60), which the workbook records as 6.88 times the rope-fiber estate (B61). Smelting and charcoal labor adds 111 people (B62), for a copper department of 299 (B63).
That woodland figure is not a separate estate from the one in the wood-fuel ledger, and the two must be read together: the 110.1 square kilometers for copper smelting is a component of the managed-woodland total reported in the wood-fuel section, alongside oven and brewery fuel. It is reported here because the copper argument and the timber argument share a denominator. Reporting them separately would obscure that shared draw.
One scope boundary belongs with this finding, because it runs in the conventional account's favor and a reviewer would otherwise raise it. The copper chain above covers quarry cutters and rough dressing masons only. Final shaping, fitting, setting, casing, alignment, and rework are integrated as Wave 1 for their direct labor, but their additional copper-tool demand; 1.3797 tonnes a year at ShapingSetting_33!B66; is a separate diagnostic and is NOT integrated into the figures above or into the Bir Nasib comparison. Until v0.84 the quarry copper-user count also carried the 113.4-person shaping and setting crew, contradicting its own label and double-charging shaping copper against the separate diagnostic; ruling MR-13 restored the quarry-only scope, and the comparison is reported at that figure. An earlier draft's statement that adding the shaping diagnostic would give 8.12x is withdrawn; it was computed as if the crew were not already in the count.
Almost every lever in this chain is an assumption: ore grade, mining rate, charcoal per kilogram of copper, wood per kilogram of charcoal, smelting labor, woodland yield, and the share of woodland available (Inputs_03!B63, B64, B65, B66, B67, B69, B70). Only the Bir Nasib output ceiling is sourced. The 7.16x and 11.01% comparisons are therefore the defensible headline; the woodland footprint is a sized consequence, and is reported as one.
One reading note on the copper comparator, recorded once (v0.64): the Bir Nasib all-time output ceiling of roughly 5,000-5,500 tonnes is dominated by Late Bronze Age and New Kingdom smelting, roughly a millennium after Khufu. Abdel-Motelib et al. (2012) report the metallic total and attribute the calculation to Bachmann; they do not identify the calculation's primary publication. The Old Kingdom-era ceiling is therefore lower than the all-time figure the model grants, and the 7.16x and 11.01% comparisons are computed against the inflated denominator; generous to the conventional scenario as used.
7.11 Shaping, Fitting, Setting, Casing, and Rework
ShapingSetting_33 is now a quantified shaping/setting/casing/rework diagnostic with an explicit M3 integration-readiness gate. Model_04 B48 remains quarry-only copper-tool demand. Final shaping, fitting, trimming, setting, alignment, casing, copper-tool wear, timber support, and rework are priced at the base screen and integrated into M2/M3 (Wave 1); productivity, tool wear, casing scope, and support materials remain open levers.
| Shaping/setting diagnostic | Base result |
|---|---|
| Final shaping/trim active labor | 25.7 active workers |
| Setting/alignment support active labor | 82.3 active workers |
| Casing active labor | 0 in base screen |
| Rework/correction active labor | 5.4 active workers |
| Base diagnostic total | 113.4 active / 197.1 rostered |
| Diagnostic population if integrated | 1,173 people |
| Copper/tool diagnostic | 1.38 t/yr gross copper incl. supply-chain loss |
| M3 readiness | LABOR INTEGRATED (Wave 1). The additional shaping/setting copper-tool demand (1.3797 t/yr, ShapingSetting_33!B66) and timber-support diagnostics are NOT integrated into M3 or into the copper comparison in Section 7.10. |
7.12 Diagnostic Integration Matrix
DiagnosticIntegration_35 is the current governance layer for open diagnostic modules. It records M3 readiness and prevents first-order diagnostic burdens from being treated as additive headline totals. This is a control layer, not a new burden total.
| Module | Diagnostic status | M3 ready? | Why outside M3 |
|---|---|---|---|
| Food feedback | Ruled: named ceiling | No | Headline M3 uses the direct-cropland lower-bound; feedback-solved ceiling ~1,603,797 published (Sec 7.3). |
| Sanitation/medical | Support diagnostic | No | Rates, materials, and feedback remain open. |
| Processing/fuel/containers | Handling diagnostic | No | Non-additive risk; household vs standing labor unresolved. |
| Shaping/setting | Quantified diagnostic | Yes (Wave 1) | Integrated; casing scope and tool-wear levers remain open. |
| Timber | Stock/replacement diagnostic | Labor: Yes (Wave 3) | Material screen control-only; labor integrated via TimberLabor_40. |
| Ramp | Material/traffic/removal diagnostic | Yes (Wave 4) | Integrated; surface and phasing levers remain open. |
The diagnostic modules are not additive headline totals. They identify required construction and support functions, first-order exposure, and readiness gaps. A diagnostic burden enters M3 only after productivity, material basis, person-category treatment, food/water feedback, and double-count controls are resolved.
7.13 Bounded Source-Input Audit: The Integrated Edge-Ramp (IER) Model
In 2026, Vicente Luis Rosell Roig published “A Computational Framework for Evaluating an Edge-Integrated, Multi-Ramp Construction Model of the Great Pyramid of Giza” in npj Heritage Science 14, article 142, DOI 10.1038/s40494-026-02405-x. The study proposes an Integrated Edge-Ramp (IER) construction model. It couples parametric geometry, discrete-event logistics, and staged finite-element analysis and concludes that an adaptive multi-ramp schedule can sustain the required block cadence within the reign window. The author published the complete code and datasets openly. The availability of the study’s code and datasets makes independent examination of its published geometry and traffic outputs possible.1 The analysis uses the author’s v1.0.14 public data deposit; the published article identifies the earlier archived release used for publication.
This analysis is an independent system-closure audit of the conventional Great Pyramid construction explanation. It uses published findings, parameters, and model outputs from multiple sources. Those source inputs retain their original attribution. The assumptions introduced here, and the resulting derived requirements, integrated calculations, and conclusions, are the work of Quantifying Antiquity.
The Integrated Constructibility Model uses the IER study’s published geometry, friction basis, lane dimensions, corner architecture, and traffic log as source inputs for a bounded module within the audit. Two of those source parameters coincide with assumptions used elsewhere in the Integrated Constructibility Model: the IER work calendar is a 10-hour day, six days per week, matching the modern-practice availability floor in Section 3. Its block mass and team sizes also sit near the model’s steelman values. On its own terms, the IER study prices the mechanics and the schedule. It does not price the support system. The IER study identifies compacted adobe or short planking and sand as means of leveling the stepped floor and uses a friction basis associated with approximately 5% water saturation. It does not specify a planked share or a corner-bay surface. The Integrated Constructibility Model therefore treats the 30% planked share and full planking of corner bays as assumptions introduced by Quantifying Antiquity.
The published IER simulation log supplies the wear driver: 670,264 loaded sledge-kilometers on ramp surfaces across 2,236,463 blocks; 670 million lane-meter passes before any empty return. Priced at a 2,000-pass plank service life, 30% planked share, and 70 mm decking, the replacement stream is approximately 26,700 cubic meters of planking over the build, about 1,340 cubic meters per year and 161 times the peak standing stock. Both ratios use the installed-volume basis, meaning planking in service, and both sides of the standing-stock ratio are installed, so that comparison is like-for-like. The study’s zero-footprint recycling claim is true of the standing stock, which is the denominator of that ratio; wear is the numerator, and abraded planking does not return to service.
The comparison against the cedar-import comparator is a different case. That comparator counts raw cedar as it arrived on ships, so the numerator must be raw timber as it must arrive; log against log. Ruling MR-07 (MethodsRulings_48) settles this on the felled basis: the full loss stack sits downstream of delivery, so the governing figure is 69,265.8 cubic meters felled (IERRampTimber_38!B30), or 25.2 times the comparator, not the 9.7 times that the installed-volume basis returns. The workbook cell IERRampTimber_38!B32 carries the felled basis as of v0.70 and reads 25.23x, matching TimberSystem_31!B40, which was already on that basis. Sensitivity moves with it: at a 5,000-pass service life the stream remains roughly ten times the cedar comparator. Earlier drafts of this paper reported 9.7 times and, at the 5,000-pass setting, roughly four times; both were installed-volume figures against a delivered comparator and are superseded by ruling MR-07. This ramp-planking figure is a single-stream ratio and is not the all-streams timber finding, which is carried in Section 7.6 and Finding F27.
As of v0.62 the reuse claim is priced as a lever rather than argued. The workbook carries a plank service-life multiplier for flipping and down-grading worn decking (DEFAULT 1.0), so the 26,700 cubic meters is now the DEFAULT of a levered quantity, not a fixed number. At the STEELMAN setting of 2.0; every plank flipped and run to a second full life, the replacement stream halves to roughly 13,370 cubic meters per build and the conventional scenario is granted 714 rostered timber men in full, propagated through the timber labor chain into M3. The verdict does not move. Fuel down-cycling is credited separately in the wood-fuel ledger (Section 10.3), capped at actual fuel demand, so the lever cannot spend the same wood twice.
Two further burdens are logged as open items on the module sheet. First, lane wetting at the study’s own saturation specification adds a modest volume (roughly 23,000 liters per day on average) but every liter climbs to the active course, and the carriers ascend the same 3.8-meter lanes that the study’s queuing model fills with block traffic at 4-6 minute headways; the study acknowledges counterflow in single-ramp phases and does not model support traffic. Second, between-pull holdback: sledges on a 7-degree grade must be blocked behind during team repositioning or they run back; standard dunnage practice in modern haulage; adding timber consumables, chock crews, and cycle time that a continuous-speed model does not carry.
The bounded module reproduces the IER schedule result within the source study’s stated scope. When the associated support requirements are carried into the Integrated Constructibility Model, the module does not establish system closure. IERRampTimber_38 remains outside M3 as a direct control module. Its planking output feeds TimberLabor_40, and the resulting timber labor is integrated into M3 as Wave 3. The material finding and remaining module gates remain outside the population headline.
8. Workforce Ledger and Population Burden
The model separates active labor from rostered labor and separates both from household/dependent population. This is a critical distinction. A headcount of people physically present in a settlement is not the same as an effective continuous labor pool. Rostered labor accounts for availability, replacement, rest, rotation, and attrition assumptions. Household/dependent population accounts for the wider support footprint implied by standing labor departments.
| Population category | Current value | Notes |
|---|---|---|
| On-site rostered workers | 47,316 | Current M3 on-site rostered construction/support total. |
| Implied on-site village population | 281,643 | Published cumulative-roster burden x the conventional-baseline ratio of 5.9524. Equivalent statement: the published roster is 11.27x the 4,200 conventional-baseline workforce; the corrected-basis derivative is 8.35x (MR-21/MR-22). |
| Off-site project-dedicated population | 250,848 | Rope/fiber, copper/tools, food, timber, and other off-site project-support households after farmer roster correction, plus the granite corps carried as bodies only. |
| River/harbor standing organization | 743 | Wave 6, bodies only (RiverHarbor_47!B29). Rostered without households, so it enters M3 beside the household-multiplied off-site block rather than inside it. |
| Total project-dedicated population | 533,234 | Current M3 headline. |
8.1 Village Sufficiency Test (Wave 2)
Food processing, sanitation, basic medical care, and container circulation are support functions performed by people who live inside the worker village rather than by additional off-site labor. The excavated settlement ratio (approximately 5.95 villagers per rostered worker) already contains such people implicitly. Adding their headcounts to the project-dedicated total would double-count the ratio.
This model therefore does not stack them. Instead it runs a sufficiency test: it sums the village-internal support headcount the model’s own modules require and compares that to the non-worker population the settlement ratio actually supplies. At current assumptions the required village-internal support is approximately 25,300 against roughly 234,300 non-worker villagers supplied, or about 10.8%, so the ratio is sufficient to staff its own support functions, and the test returns WITHIN RATIO.
At default assumptions this test does not break the settlement ratio. Its value is structural. The model publishes the excavated ratio (5.95) as a floor and a bottom-up derived village multiplier (5.61 at current levers: one worker, plus dependents, plus required internal support) as an audit of it. The derived multiplier tracks the support burden directly. Tightening the caregiver-to-population ratio, milling rate, or sanitation-coverage assumptions raises required support and moves the test toward RATIO INSUFFICIENT without any change to the headline method. The sufficiency test is a standing diagnostic, not a one-time claim, and it is immune to the double-counting objection that headcount stacking would invite.
9. Kingdom Capacity and Mobilization-Capacity Bands
The kingdom-capacity sheet compares the total project-dedicated population footprint against the standard scholarly anchor for the Old Kingdom population comparator of 1.6 million. This is intentionally generous and is treated as a stress-test denominator, not a literal census figure. The workbook cites Karl W. Butzer, Early Hydraulic Civilization in Egypt, Table 4, 2500 B.C., as the source basis for this comparator.
The model now uses mobilization-capacity bands rather than a single hard cutoff. The 150,000 line is retained only as a working upper stress screen inside the band table. It is not a sourced historical ceiling, and the 9.375% figure is arithmetic only: 150,000 divided by 1,600,000.
| Capacity metric | Current value | Interpretation |
|---|---|---|
| Old Kingdom population denominator | 1,600,000 | Standard scholarly anchor comparator. |
| Current M3 project-dedicated population | 533,234 | Live M3 population footprint. |
| Share of kingdom | 33.33% | Primary population-share metric. |
| Capacity-band position | Above the 500,000 band | Primary framing. The table's top band is labeled kingdom-scale reorganization. |
| 150k working upper stress screen | 150,000 | Reference screen only, not a hard historical ceiling. |
| Current model / 150k screen | 3.55x | Secondary reference only. |
| Excess above 150k screen | 383,234 | Secondary reference only. |
| Project-dedicated population | Share of 1.6M | Capacity-band label |
|---|---|---|
| 50,000 | 3.13% | Heavy but plausible state project |
| 75,000 | 4.69% | Severe national commitment |
| 100,000 | 6.25% | Extreme long-duration burden |
| 125,000 | 7.81% | Severe stress transition band |
| 150,000 | 9.38% | Working upper stress screen |
| 200,000 | 12.50% | Extraordinary systemic burden |
| 300,000 | 18.75% | Requires exceptional proof |
| 500,000 | 31.25% | Kingdom-scale reorganization |
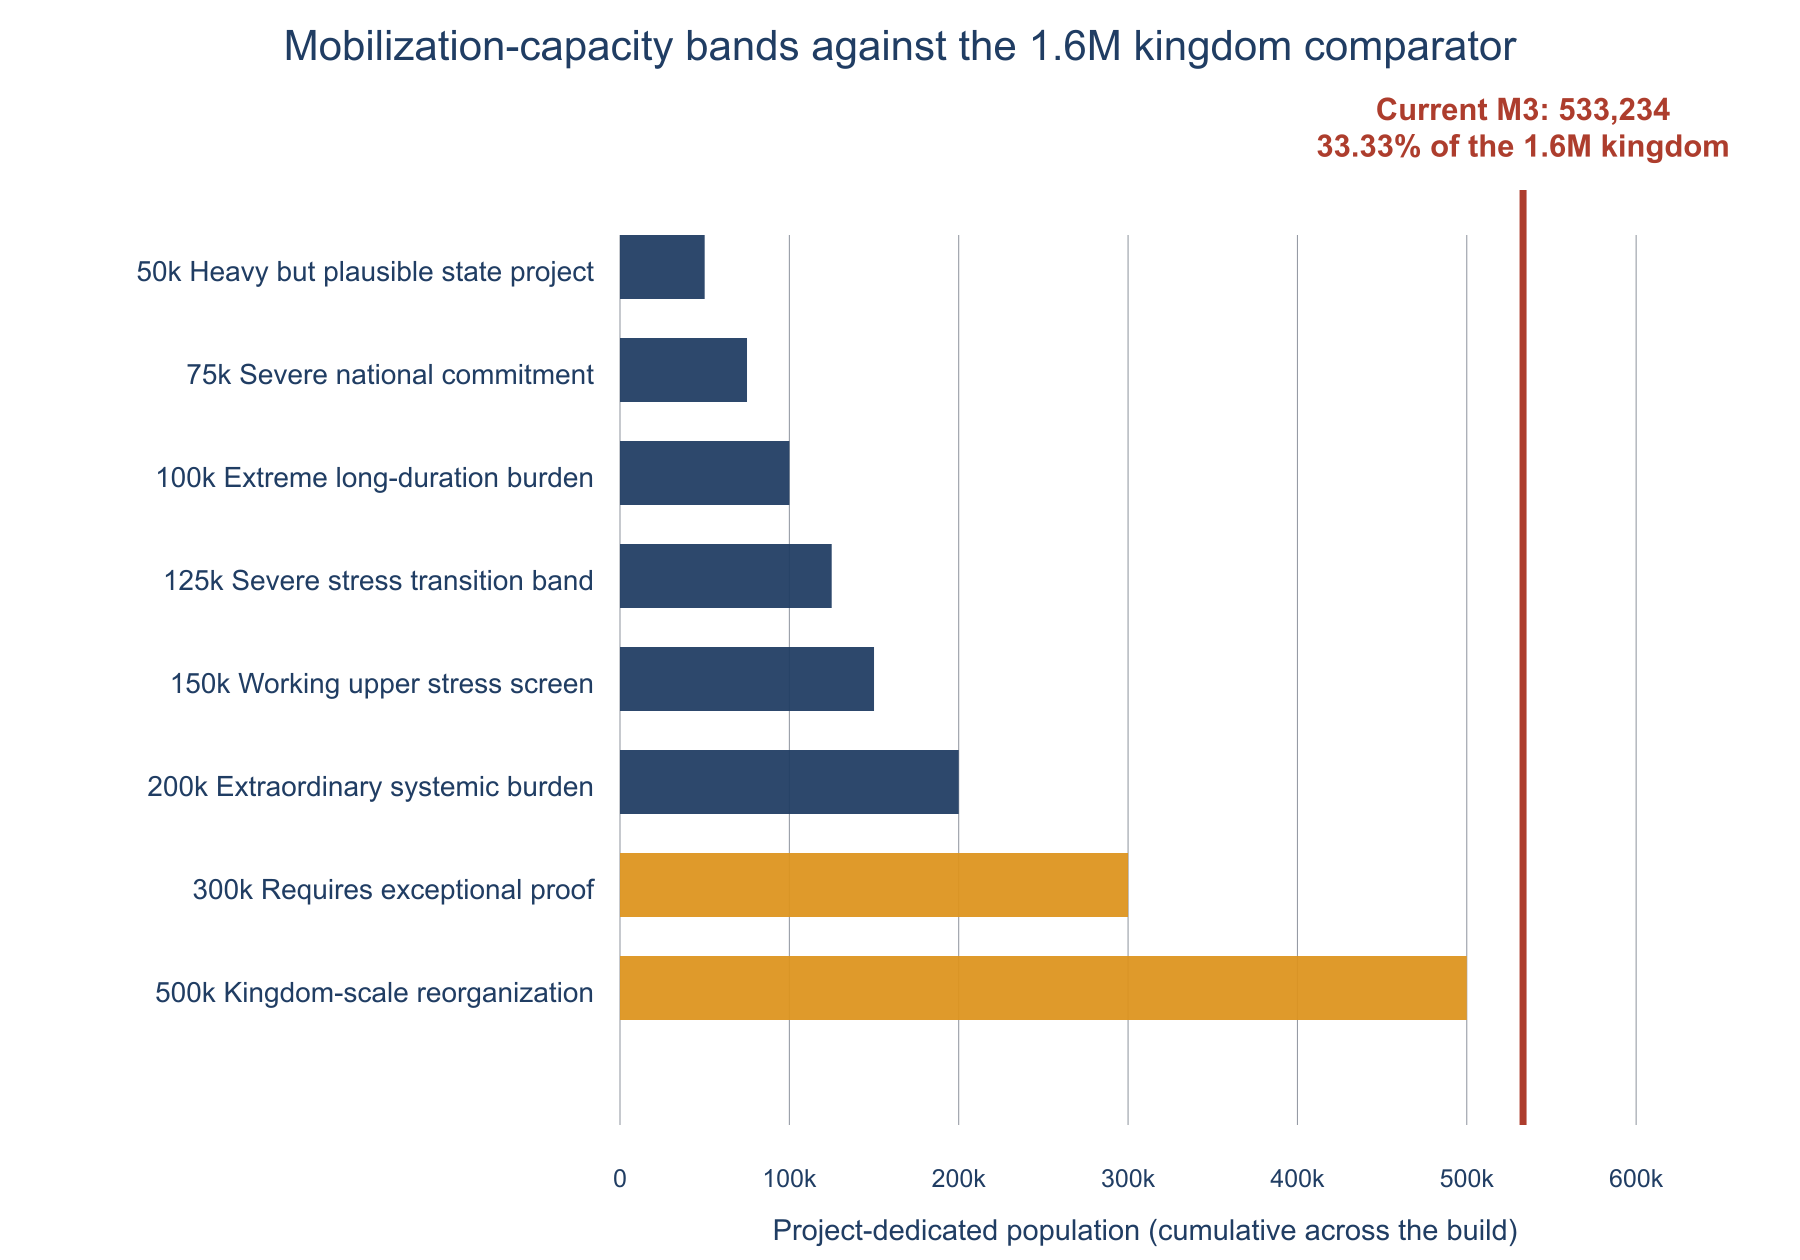
Figure 3. Capacity-band position: the current M3 population exceeds the highest band, kingdom-scale reorganization, before pending additive burdens are integrated. The plotted population is a cumulative count of distinct individuals across the build, not a standing population.
The evidentiary support for this framework does not come from a single sourced percentage. It comes from several lanes: the Old Kingdom population comparator provides the denominator; the archaeology of Heit el-Ghurab shows organized provisioning; published workforce estimates provide scale comparison; Old Kingdom provisioning networks support treating required off-site output as economically project-dedicated; and preindustrial agrarian surplus logic supports testing large output and labor diversions against available surplus.
Published subsistence research independently identifies the same limiting resource. Modeling the Old Kingdom provisioning network from the faunal record at both of its ends, the Kom el-Hisn production site and the Giza worker town, Redding concludes that "labour, not land, must have been the limiting factor" (Redding 2013). Labor is precisely the resource the closure tests in this section price.
The model reports the current burden across bands. The 533,234-person project footprint exceeds the table's highest band, kingdom-scale reorganization, before the remaining additive burdens are integrated. Draft v3.5 placed the result between the 300,000 and 500,000 bands. The population architecture corrected in v0.89 and retained in v0.92 moves it past the end of the scale.
9.1 National Closure Test: Male Labor and Agricultural Surplus
Test 1 measures concurrent non-farm project labor against the available non-farm prime-age male labor pool. Test 2 measures the agricultural production and household burden assigned to the farm side. The tests operate as a pair so that annual-yield farmers are not counted simultaneously as non-farm labor and agricultural burden.
The population-share metric, while striking, understates the problem. A construction project does not draw on a national population in the abstract. It draws on two specific and far scarcer resources: prime-age male labor, and agricultural surplus. The national closure test evaluates the project against both, and it is the point at which the integrated model returns a definite verdict.
Consider the labor cohort first. The priced construction departments are male labor categories, so the denominator is the matching male cohort. In a high-mortality preindustrial agrarian population, the working-age, physically-fit share is on the order of one in four or fewer. Applied to the male half of the population, the model takes 24% of the total population as the working-age, physically fit male cohort (roughly 0.50 male by 0.48 working-age-fit), generous at both terms. Against the 1.6 million anchor, that is approximately 384,000 prime-age males for the entire kingdom.
Most of that labor cannot leave the land. Preindustrial societies commit the large majority of their labor simply to feeding themselves. The model reserves 80% of the male cohort to sustain food production, which is a low reservation and therefore generous. What is reserved is labor, not an occupational census. The reservation is one term in a food-balance system that also deducts farmer-household consumption before surplus is counted, and that removes annual-yield farmers from the Test 1 numerator because their burden is priced in Test 2. After the 80% agricultural reservation, approximately 76,800 prime-age men remain for every non-farm function in the kingdom. The Great Pyramid program draws from this same pool alongside the army, temples, administration, trade, every other state construction project, and the rest of the non-farm economy.
The project's own rostered labor demand, integrated across all priced departments, is approximately 100,455 people. That total includes 46,350 rostered annual-yield farmers: the grain and fiber growers on project-dedicated land. Test 1 does not count them. The reason is structural, and it answers the strongest objection this test faces. A critic can argue that counting project farmers against the non-farm pool charges the same people twice: once as labor drawn from a pool defined to exclude farmers, and once as agricultural burden in Test 2. The objection is fair, and the model concedes it in full (Finding F24, ruling 2026-07-09). Annual-yield farmers are farm-side labor. Test 2 prices their entire burden: land, households, and surplus draw. They are removed from the Test 1 numerator.
What remains is the ex-farmer numerator, and it has two forms that must not be confused. On the rostered basis it is 54,105, the cumulative distinct men who pass through those posts over the whole build. On the concurrent basis it is 47,342: the men on the books at any one moment. The pool of 76,800 is a single-moment figure, so the concurrent numerator is the one that belongs against it. That dimensionally consistent concurrent-to-standing share is 61.6%.
That correction lowers the headline. Until v0.81 the numerator was the rostered figure, which is men on the books across the whole build: it embeds both the daily coverage factor, a genuine standing requirement, and the mortality replacement multiplier, which is a flow over twenty years. The denominator is a single-moment standing pool. Dividing one by the other mixed a flow into a stock. The correction is not a matter of preference, because the kingdom cycles through its own cohort at the same multiplier: concurrent labor against the standing pool, and cumulative distinct men against the cumulative distinct pool, return the identical share of 61.6% (NationalClosure_41!B40 and B41, with a live consistency check at B42). Only the mixed pairing differed, and it is retained at B43 so the correction is visible rather than silent. Ruling MR-08. The finding is smaller and materially harder to attack.
That share is measured against a single-project mobilization ceiling of 25%. The ceiling is an ASSUMPTION, not a documented historical maximum. No surviving record states how much of its workforce a pre-modern state could commit to a single construction program; comparative history suggests a band of roughly 10% to 25% of non-farm labor on major state building, sustained over years, while the same state still funds its army, temples, administration, trade, and other construction. The model takes the top of that band, the setting most favorable to the conventional explanation, and exposes it as a live lever (ClosureSensitivity_45 B5). The ex-farmer demand is 2.5 times that ceiling.
The argument does not rest on that ceiling being a law, and the model now states the requirement directly as well. At the sourced demographic anchor, a conventional scenario must demonstrate that Khufu's state could sustain approximately 62% of all non-farm prime-age male labor on this one project, continuously, while simultaneously operating the army, administration, temples, trade, and every other construction program (NationalClosure_41!B45). A critic who rejects 25% owes a supported alternative ceiling, and must show it reaches 62%. The inclusive figure of 130.8% compares all rostered labor, including project farmers, with the same pool. It is retained as a transparency line so the pre-ruling framing remains visible, but it is not the reported Test 1 share.
| National closure metric | Value | Reading |
|---|---|---|
| Prime-age male cohort (24% of 1.6M) | 384,000 | Generous high share; ~0.50 male x ~0.48 working-age-fit |
| Non-farm male labor pool (after 80% reserved) | 76,800 | The real labor pool for all male state functions |
| Test 1 labor (ex-farmer numerator, F24) | 54,105 | All priced departments minus annual-yield farmers |
| Test 1 labor, CONCURRENT (men on the books at one moment) | 47,342 | Rostered figure less the mortality replacement flow |
| Share of the whole male cohort (rostered/standing) | 14.1% | Transparency line; dimensionally mixed |
| Share of the non-farm male labor pool (CONCURRENT / STANDING) | 61.6% | 2.5x the 25% single-project mobilization ceiling |
| Same share on a CUMULATIVE / CUMULATIVE basis | 61.6% | Identical by construction; the consistency check |
| Share on the pre-v0.81 ROSTERED / STANDING basis | 70.4% | Retained so the correction is visible; mixes a flow into a stock |
| Inclusive share (transparency line) | 130.8% | Pre-ruling framing, retained; not the Test 1 share |
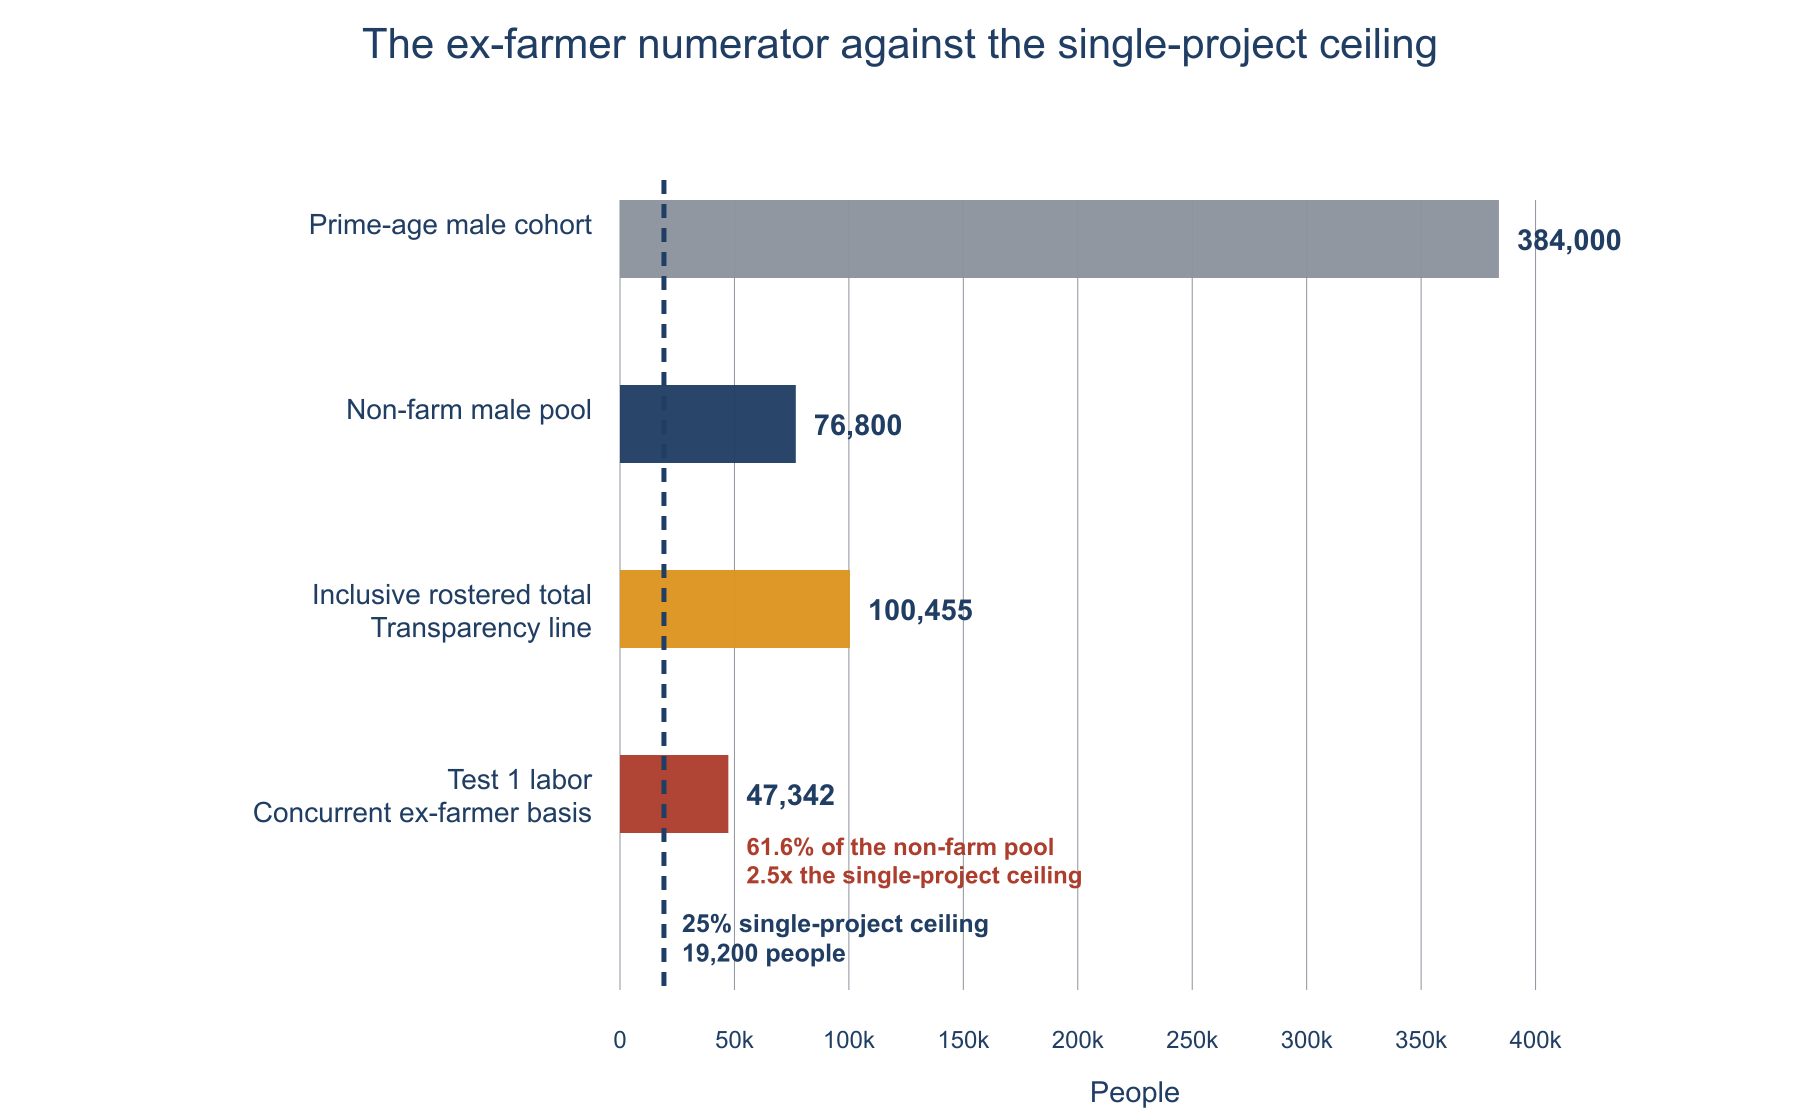
Figure 4. The national closure test on the ex-farmer numerator: Test 1 labor against the non-farm pool and the 25% single-project mobilization ceiling, with the inclusive rostered total retained as the transparency line.
At the sourced 1.6 million anchor, the finding survives every tested combination of the demographic levers. Three levers determine the non-farm pool: population, male-cohort share, and agrarian share. A critic can widen it by pushing all three. The closure sensitivity grid (workbook sheet ClosureSensitivity_45) rebuilds the test on the ex-farmer numerator across the full range: male cohort share from 20% to 30%, agrarian share from 85% down to 65%, and population from 1.6 million to an implausibly high 2.5 million. Only the 1.6 million figure is the sourced anchor for the period; 2.0 million is an out-of-period favorable stress test and 2.5 million is a later-era extreme, and both are labeled as such rather than presented as parts of a defensible range.
On the corrected concurrent population basis (MR-12), Test 1 stands at 61.6% at the sourced 1.6 million anchor and DEFAULT levers; two and a half times the 25% benchmark. Across the sourced anchor's sensitivity grid, all 30 cells exceed the benchmark (ClosureSensitivity_45!B36 = 0 cells below). The grid's most extreme corner, a 30% prime-age fit male share combined with only 65% agrarian labor, both levers at or past their generous limits simultaneously; still returns 28.2%, and the next corner out at 70% agrarian labor returns 32.9%. The finding therefore holds at the sourced anchor without exception. This restores the position of drafts before v0.84: the two clearing corners reported in the intervening revisions were an artifact of a population basis since corrected, and the change is reported rather than smoothed. The verdict does not in any case depend on exceptionlessness. It depends on the sourced anchor at documented levers, where the demand is 2.5 times the benchmark. Only in the 2.0 million out-of-period stress test do any cells fall below it: two, at 24.2% and 22.5%. The model does not treat a corner assembled from three independent favorable extremes as a historical scenario on its own. A supported historical scenario requires a sourced Old Kingdom demographic configuration that produces a sufficient non-farm pool and a showing that the complete construction system closes under it. The verdict is robust across the defensible range and is no longer exposed to the farm/non-farm double-jeopardy objection.
The imported-labor lever does not reverse the test. As of v0.62 the model carries an imported-labor share lever (DEFAULT 0, because the conventional account assigns the workforce to Egypt). Moving it does not rescue the test. Imported labor shifts only the pool draw; the food, water, housing, and population burdens are nationality-invariant; a foreign hauler eats, drinks, and lives in the same village as a domestic one. The documented record points the same way: the Weni inscription shows foreign auxiliaries raised episodically for single campaigns, never sustained for decades.
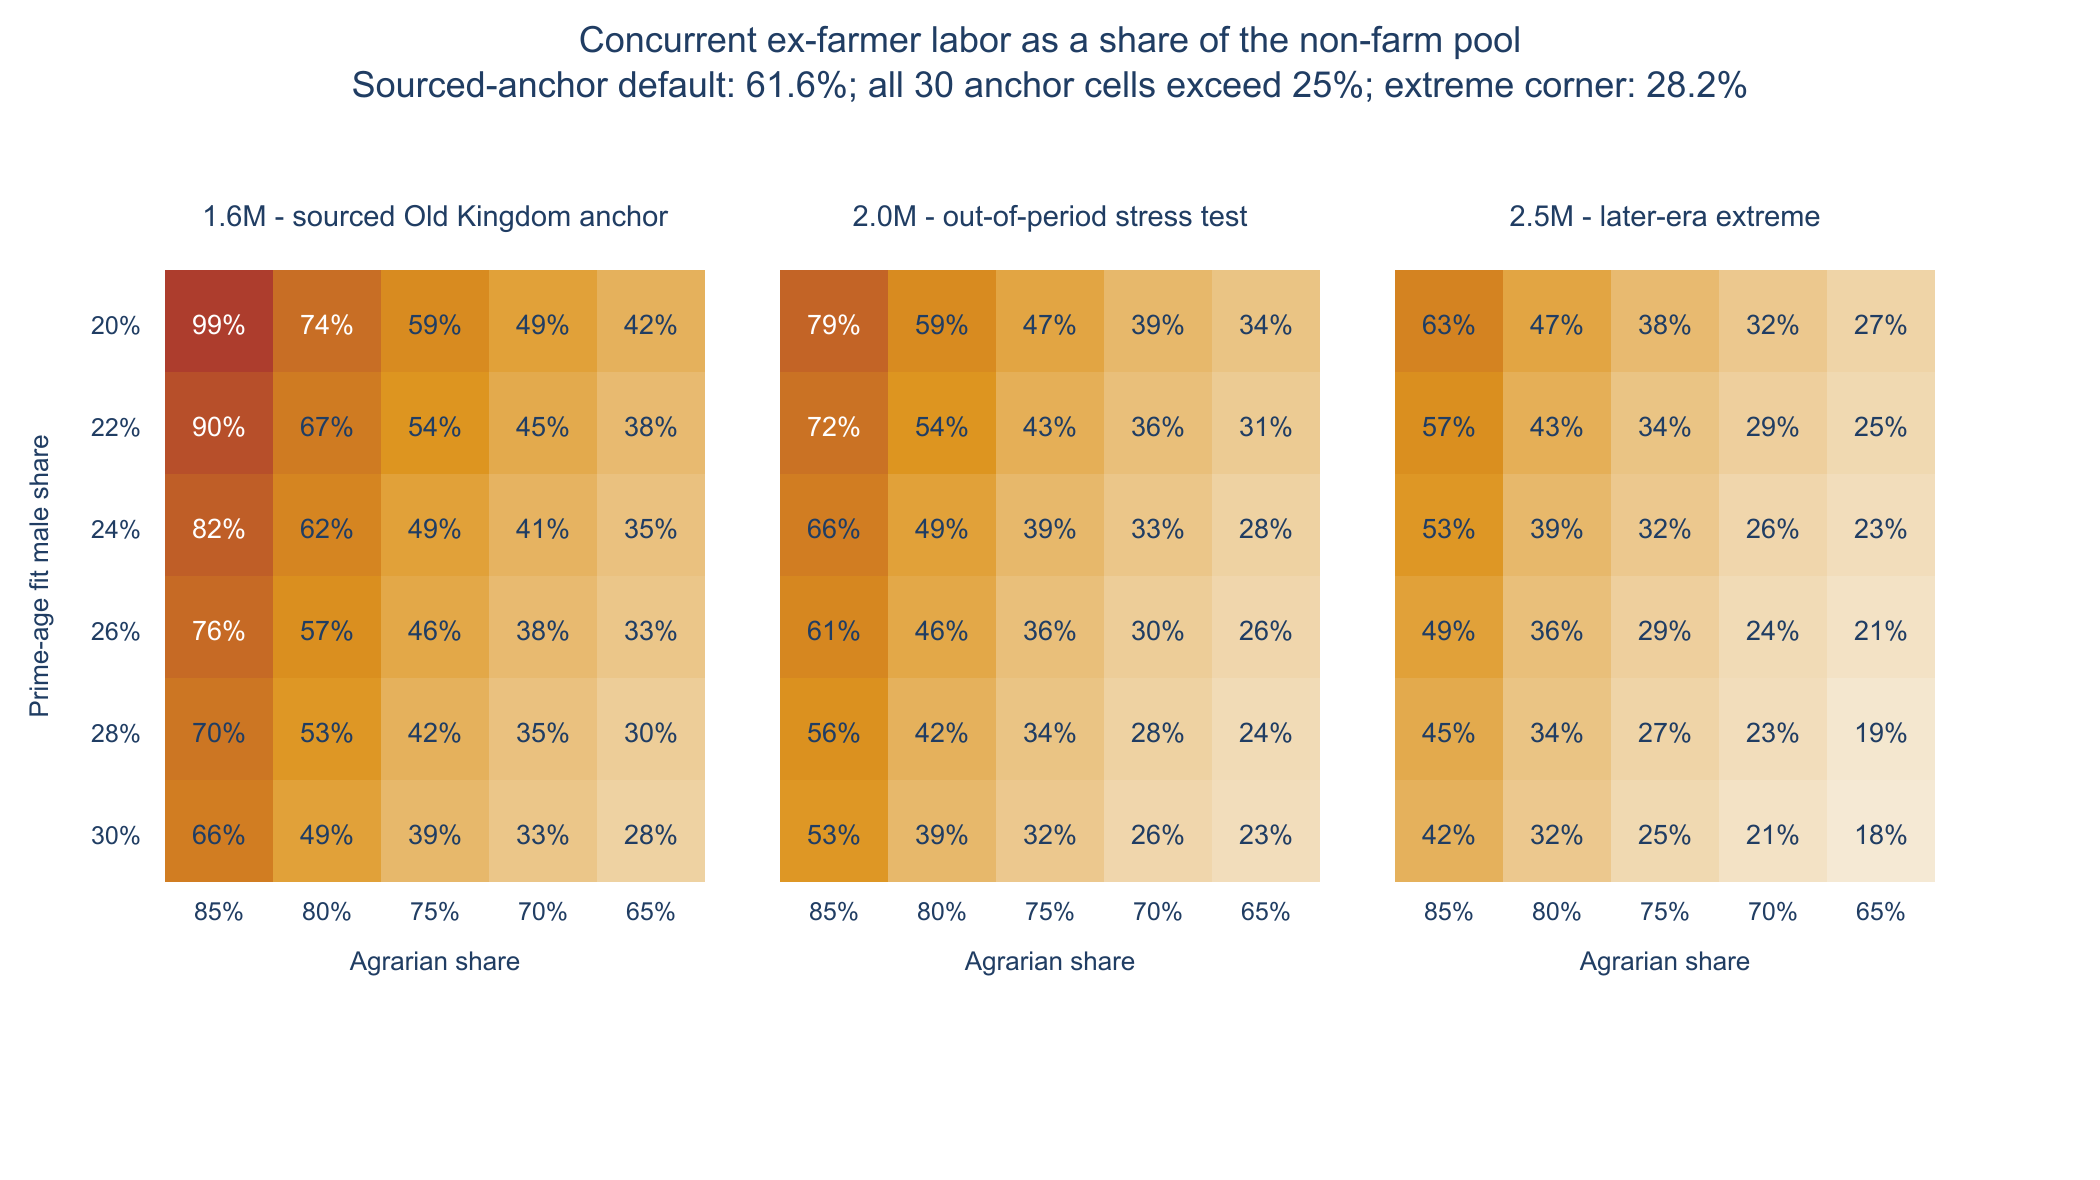
Figure 5. Closure sensitivity on the concurrent ex-farmer numerator (MR-08). Above the 25% single-project benchmark at every cell of the sourced 1.6M anchor, whose extreme corner is 28.2%; two corners of the 2.0M out-of-period stress test fall below it, at 24.2% and 22.5%, each requiring the male-cohort and agrarian extremes simultaneously. Bold cells exceed the entire pool.
Test 2: the agricultural surplus ceiling. The section title names two resources, and the labor test above only prices one of them. Test 1 removed the annual-yield farmers from its numerator on the stated grounds that their burden belongs on the farm side. Test 2 carries that burden. Reporting Test 1 without reporting Test 2 would leave that removal unaccounted for, so both are stated.
The project's food demand is 326,027 tonnes of grain a year that the countryside must gross before anyone on site eats, taken live from the food system sheet. A farm household is credited with releasing 25% of its output above its own subsistence. The farm surplus share is an ASSUMPTION and a Dashboard lever, set generously to the conventional scenario. Meeting the demand at that rate commits 45,282 farming households to the project. With dependents, that is 226,410 people: 14.15% of the 1.6 million kingdom standing in the project's food chain alone, before a single hauler, water carrier, quarryman, or timber crew is counted.
| Test 2 metric | Value | Badge |
|---|---|---|
| Farm production committed to the project | 326,027 t/yr | LIVE |
| Farm surplus share (lever) | 25% | ASSUMPTION |
| Farming households committed to the project | 45,282 | DERIVED |
| People in the project food chain, with dependents | 226,410 | DERIVED |
| Share of the 1.6M kingdom, food chain alone | 14.15% | DERIVED |
Test 2 reports magnitude rather than a binary verdict. No surviving record fixes the share of its farm output a kingdom can commit to one project, so the model does not invent a ceiling. Test 2 is hold the farmer burden where it belongs. The 61.6% in Test 1 cannot be attacked as double-counted, and it cannot be quietly relieved by moving farmers from one test to the other. The national closure verdict stated below rests on Test 1.
The model applies the strongest available correction to the conventional scenario: every annual-yield farmer is removed from the labor numerator, and the entire farm burden is assigned to the surplus test. The project still demands 61.6% of the entire non-farm workforce, 2.5 times the benchmark this model uses for what a pre-modern state could assign to a single construction program. That pool must simultaneously sustain the military, the administration, the temple economy, trade, and the other large state construction works of the period, including the three preceding pyramids of the same dynasty built within living memory. The test returns EXCEEDS SINGLE-PROJECT MOBILIZATION CEILING, and the national closure verdict is DOES NOT CLOSE: MOBILIZATION CEILING EXCEEDED. This result holds with every lever set generously to the conventional scenario, and it holds before granite mechanisms, casing, administration, and the remaining open burdens are integrated, all of which raise the labor share further.
The 25% ceiling governs Test 1 and nothing else. It does not assert that the remaining 75% of the non-farm male labor pool would have been sufficient for the project, and bringing the share under it would reverse this verdict alone. Agricultural surplus, settlement capacity, demographic capacity, and the failed capability gates are separate fronts carrying separate ceilings from separate evidence, and none of them is satisfied by clearing this one.
One rebuttal must be addressed directly, because it is the strongest one available to the conventional scenario: seasonal corvee. The annual inundation idles a large share of agricultural labor for roughly three to four months, and it is often argued that this labor was therefore “free” for construction. The model’s own cadence answers it. The required placement rate is approximately 206 blocks per day, sustained every working day for twenty years. A workforce available for only one season per year must either triple the flood-season cadence, which the work-front density of the shrinking pyramid platform physically forbids, or triple the construction timeline, which the conventional twenty-year reign window itself forbids. The labor ceiling this test measures is an annual ceiling, and a fully seasonal build does not relieve it.
The claim stops there deliberately. A mixed seasonal and rotating system is a different proposition: it could in principle substitute farm labor for some functions in some months without compressing the whole project into one season. This model does not claim to have eliminated that, and does not invent a schedule on the conventional account's behalf; mixed seasonal and rotating labor remains listed OPEN in the workbook's adversarial test register. What is required is the schedule itself: a quantified conventional program that reduces the standing burden sufficiently while preserving cadence, work fronts, training, housing, provisioning, transport, and every other function the model prices. The model assumes peak concurrency across the support departments (water, food, timber, ramp) and treats granite as sequential; both are stated simplifications rather than outputs of a construction schedule, disclosed here as assumptions. The flood season is also precisely when the delivery basins are navigable, so peak labor, peak stone movement, and peak water transport would compete for the same months and the same settlement capacity.
The labor operation fails independently at its governing ceiling. The integrated result then confirms that the conventional scenario’s workforce framework, population anchor, construction timeline, and full support system cannot be satisfied simultaneously by the labor and surplus the kingdom possessed.
9.2 Demographic Closure: Sustained Mobilization vs Documented Capacity
The closure test in Section 9.1 prices one year of the project against one year of the kingdom. The demographic closure test prices the duration. It asks a question no annual snapshot can answer: can a kingdom of 1.6 million hold this commitment for twenty to thirty years and remain a functioning state? The test runs on workbook sheet DemographicClosure_46, is a verdict layer only; it adds no burden to M3 and uses no new demographic levers. The prime-age male cohort is the same 384,000-person pool already carried in Section 9.1, and the working span and mortality replacement are the model's own values, derived from the Giza worker cemetery.
Three tests. First, the standing extraction: the ex-farmer roster of 54,105 decomposes into a concurrent standing force of 47,342 men, 12.3% of every prime-age male in the kingdom, continuously absent from the general economy for the full build (14.1% on the rostered basis). Second, the cumulative drain: over a 20-year build, 54,105 distinct men pass through the roster; over 30 years, 81,158, of whom 33,816 are mortality replacements. The steady-state statement is the sharpest form: the project must recruit approximately 2,705 additional prime-age men every year of the build, against a national maturing cohort of roughly 21,943 per year. One in eight of every year's maturing males, nationally, every year for decades, for the non-farm departments assigned to the Great Pyramid construction program alone. The standing share and the intake share are the same finding stated two ways, not two findings. The sheet says so to pre-empt the double-count objection.
Third, the comparator that anchors the verdict to the kingdom's own record. The largest military mobilization the Old Kingdom ever documented is Weni's levy: "an army of many tens of thousands," raised from all of Upper Egypt, all of Lower Egypt, five named Nubian groups, and Libya, drawing on the entire kingdom plus foreign auxiliaries, and raised and disbanded five separate times, campaign by campaign. The figure is read at its maximum, 50,000, which favors the conventional account: a higher Weni makes the pyramid look easier. Two caveats, stated once, and both also cut in the conventional account: the inscription is 6th Dynasty, roughly two centuries after Khufu, so a later and larger state sets the ceiling high, and the figure is rhetorical, read high. The Palermo Stone's Snefru registers; 7,000 Nubian captives, 200,000 cattle; confirm the expeditionary character of the Old Kingdom military: temporary levies for targeted campaigns, no professional standing army.
Against that record, the project's standing mobilization is 0.95 times the maximum documented levy on the leaner concurrent basis, and 1.08 times it on the rostered basis, at the model's DEFAULT mortality setting.
That setting is a midpoint, and the comparison must be stated as a band. Worker replacement is driven by median male age at death, taken at 32.5, the midpoint of the sourced Giza worker-cemetery range of 30 to 35. Across that range, on the concurrent basis the verdict fires on, the standing force runs from 1.14 times the Weni maximum at age 30 down to 0.825 times it at age 35; straddling the comparator rather than sitting above it throughout. The old 0.825x to 1.520x band was the rostered comparison, which sets a twenty-year flow against a one-time levy; it is retained as a transparency line only. The band is computed live, not reproduced by hand: DemographicClosure_46 rows 48-108 duplicate the sixty-one-cell dependency chain from the mortality input to the verdict cells with live formulas, once per endpoint. A third column mirrors the same chain at the live lever and must therefore equal the live model exactly. A drift guard tests that and is surfaced in the check panel at QAChecks_08, so a stale mirror reports as a failed check rather than sitting unnoticed. The block is a pure sink; nothing outside it reads any cell inside it, and it feeds no burden, roster, feedback loop or verdict. At the top of the range the working span equals a twenty-year build and the replacement multiplier reaches its floor of 1.0. At this endpoint the model charges no mortality or age-out replacement during a twenty-year build. Daily coverage, rotation, rest, and availability requirements remain in force. Disabling injury is excluded. This is the most favorable reading the sourced range permits, and the lever saturates there.
The audit states the finding at both ends. At the midpoint and below, the project exceeds the largest mobilization the Old Kingdom ever documented. At the most generous endpoint it does not exceed it; it sits at 0.825 times, the same order of magnitude as the kingdom's maximum recorded emergency levy. The exceedance is conditional on the mortality setting; the scale is not. The comparison is not merely of size but of posture: Weni's levy was episodic; raised, marched, sent home. The project's is continuous for twenty to thirty years, drawn from the domestic non-farm pool alone, while the actual army, the temples, the administration, and every other major construction program of the dynasty must still be staffed on top of it.
| Demographic closure metric | Value | Reading |
|---|---|---|
| Prime-age male cohort (24% of 1.6M) | 384,000 | Same pool as Section 9.1; no new lever |
| Concurrent standing force (ex-farmer) | 47,342 | 12.3% of the cohort, continuously absent |
| Cumulative distinct men, 20-yr / 30-yr | 54,105 / 81,158 | Mortality-only replacement; generous |
| Annual intake of additional prime-age men | 2,705 | 12.3% of every maturing cohort, duration-invariant |
| Weni levy, maximum documented mobilization | 50,000 | Read at maximum; episodic, kingdom-wide + auxiliaries |
| Project vs Weni, CONCURRENT / CONCURRENT | 0.95x | The comparable basis: the verdict fires here (MR-09) |
| Project vs Weni, rostered / concurrent | 1.08x | Dimensionally mixed; transparency only, not the verdict |
| Project vs Weni, CONCURRENT, mortality band | 0.825x to 1.140x | Live mirrored block, sourced cemetery range 30-35 |
| Same band on the rostered basis | 0.825x to 1.520x | Dimensionally mixed; transparency only |
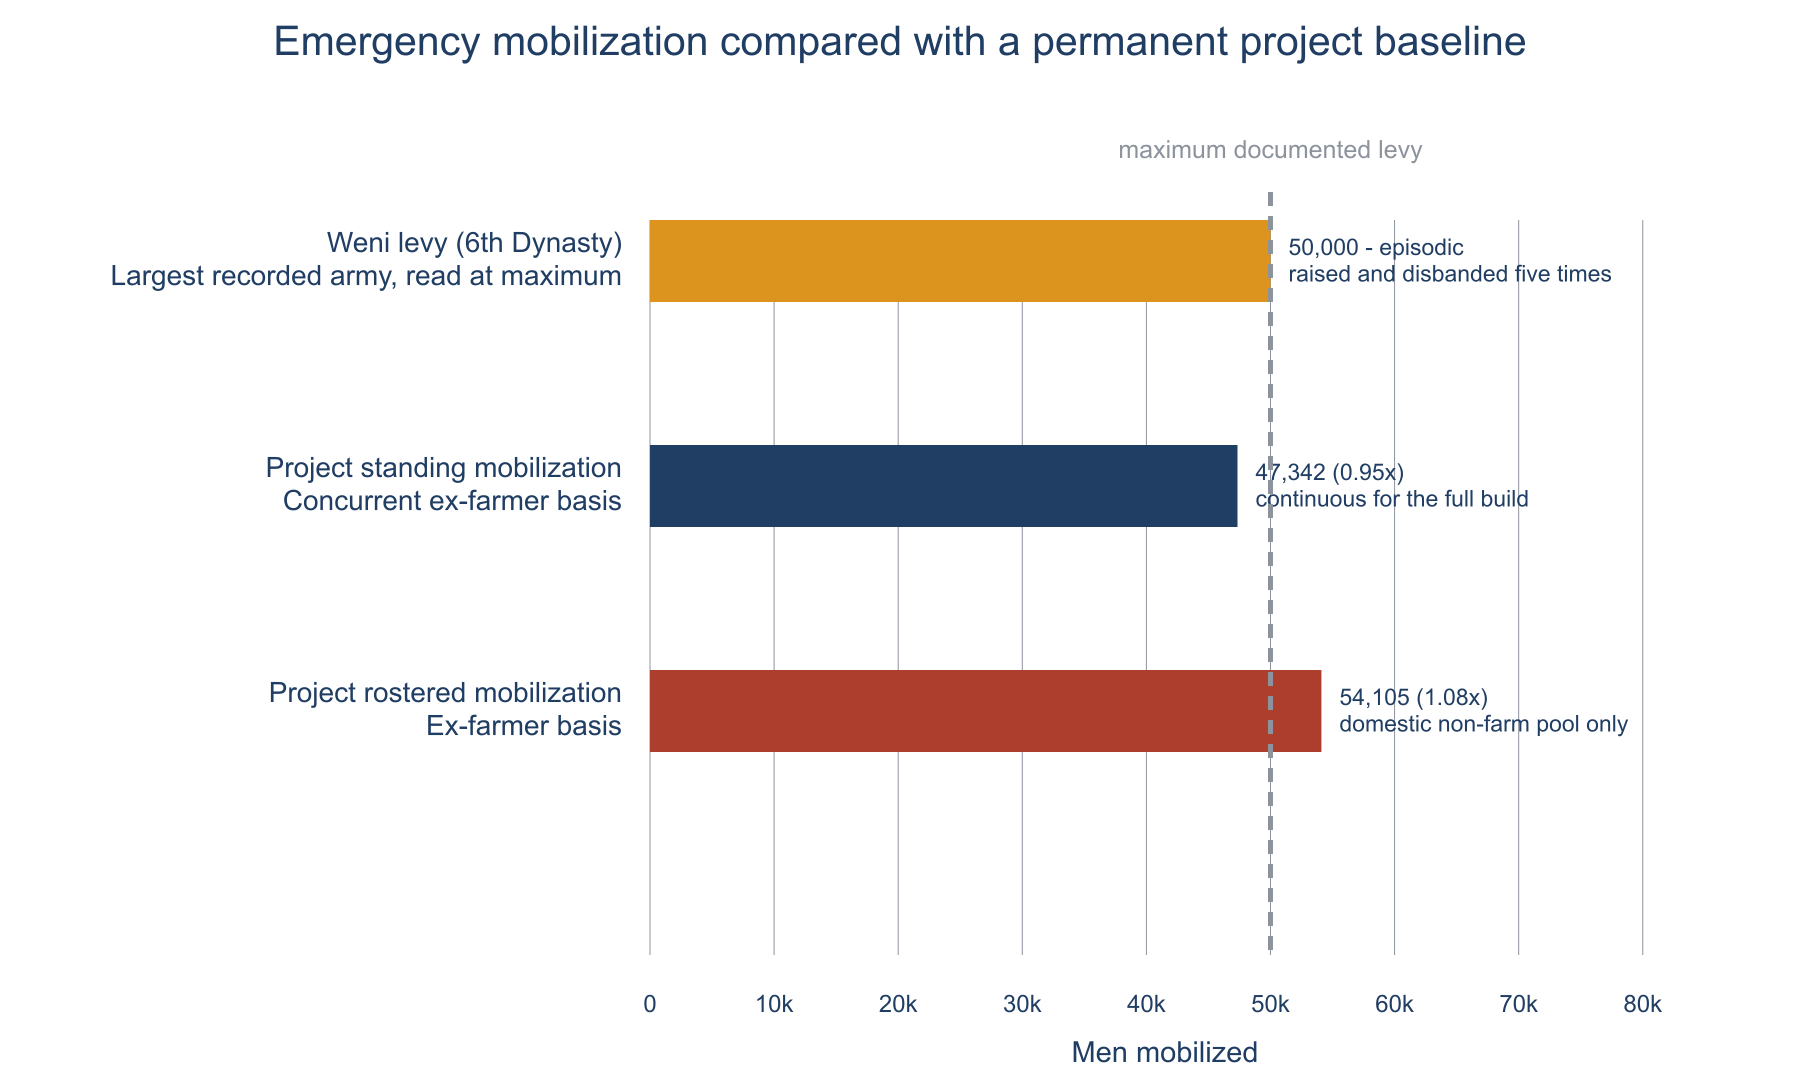
Figure 6. The demographic closure comparator: sustained project mobilization against the largest levy the Old Kingdom ever documented, read at its most generous.
The duration test compares the project's continuous ex-farmer standing force with the largest documented Old Kingdom levy, then repeats that comparison across the sourced worker-cemetery mortality range. It returns APPROACHING THE MAXIMUM DOCUMENTED MOBILIZATION, HELD CONTINUOUSLY RATHER THAN LEVIED ONCE. The demographic closure verdict is DOES NOT CLOSE: SUSTAINED MOBILIZATION AT THE SCALE OF MAXIMUM DOCUMENTED CAPACITY, HELD CONTINUOUSLY. The DEFAULT concurrent reading sits just below the comparator; the rostered transparency line and the high-mortality end of the sourced band sit above it. The finding is therefore not that the project reliably outstrips the kingdom's largest documented levy, nor that it reliably falls short of it, but that the conventional account requires the kingdom to hold mobilization at essentially the whole of that emergency scale as a permanent baseline for twenty to thirty years, consuming roughly one in every eight maturing males, before the army, the temples, trade, administration, or any other major state construction program receives any labor. Weni's levy was raised, marched, and disbanded. This one cannot be. The figure has moved across revisions; v0.84 removed the mortality-replacement flow from the standing population (MR-12) and lowered it, and the population architecture corrected since has raised it again, and each move is reported rather than smoothed. What has not moved through any of it is the order of magnitude. One adaptation argument is bounded by arithmetic: natural increase cannot supply the early and continuously required workforce: a child born in year one reaches the modeled entry age in year sixteen of a twenty-year build.
10. Peak-Load Operations and Material Supply
The material-supply findings begin with the timber delivery comparison. Figure 7 reports the felled-basis volume that must arrive, converted into shiploads, against the largest documented single timber import of the period. The comparison measures magnitude; it does not treat the forty-ship record as a fixed ceiling on Egyptian import capacity. Section 10.2 provides the full derivation, sensitivity treatment, and reversal condition.
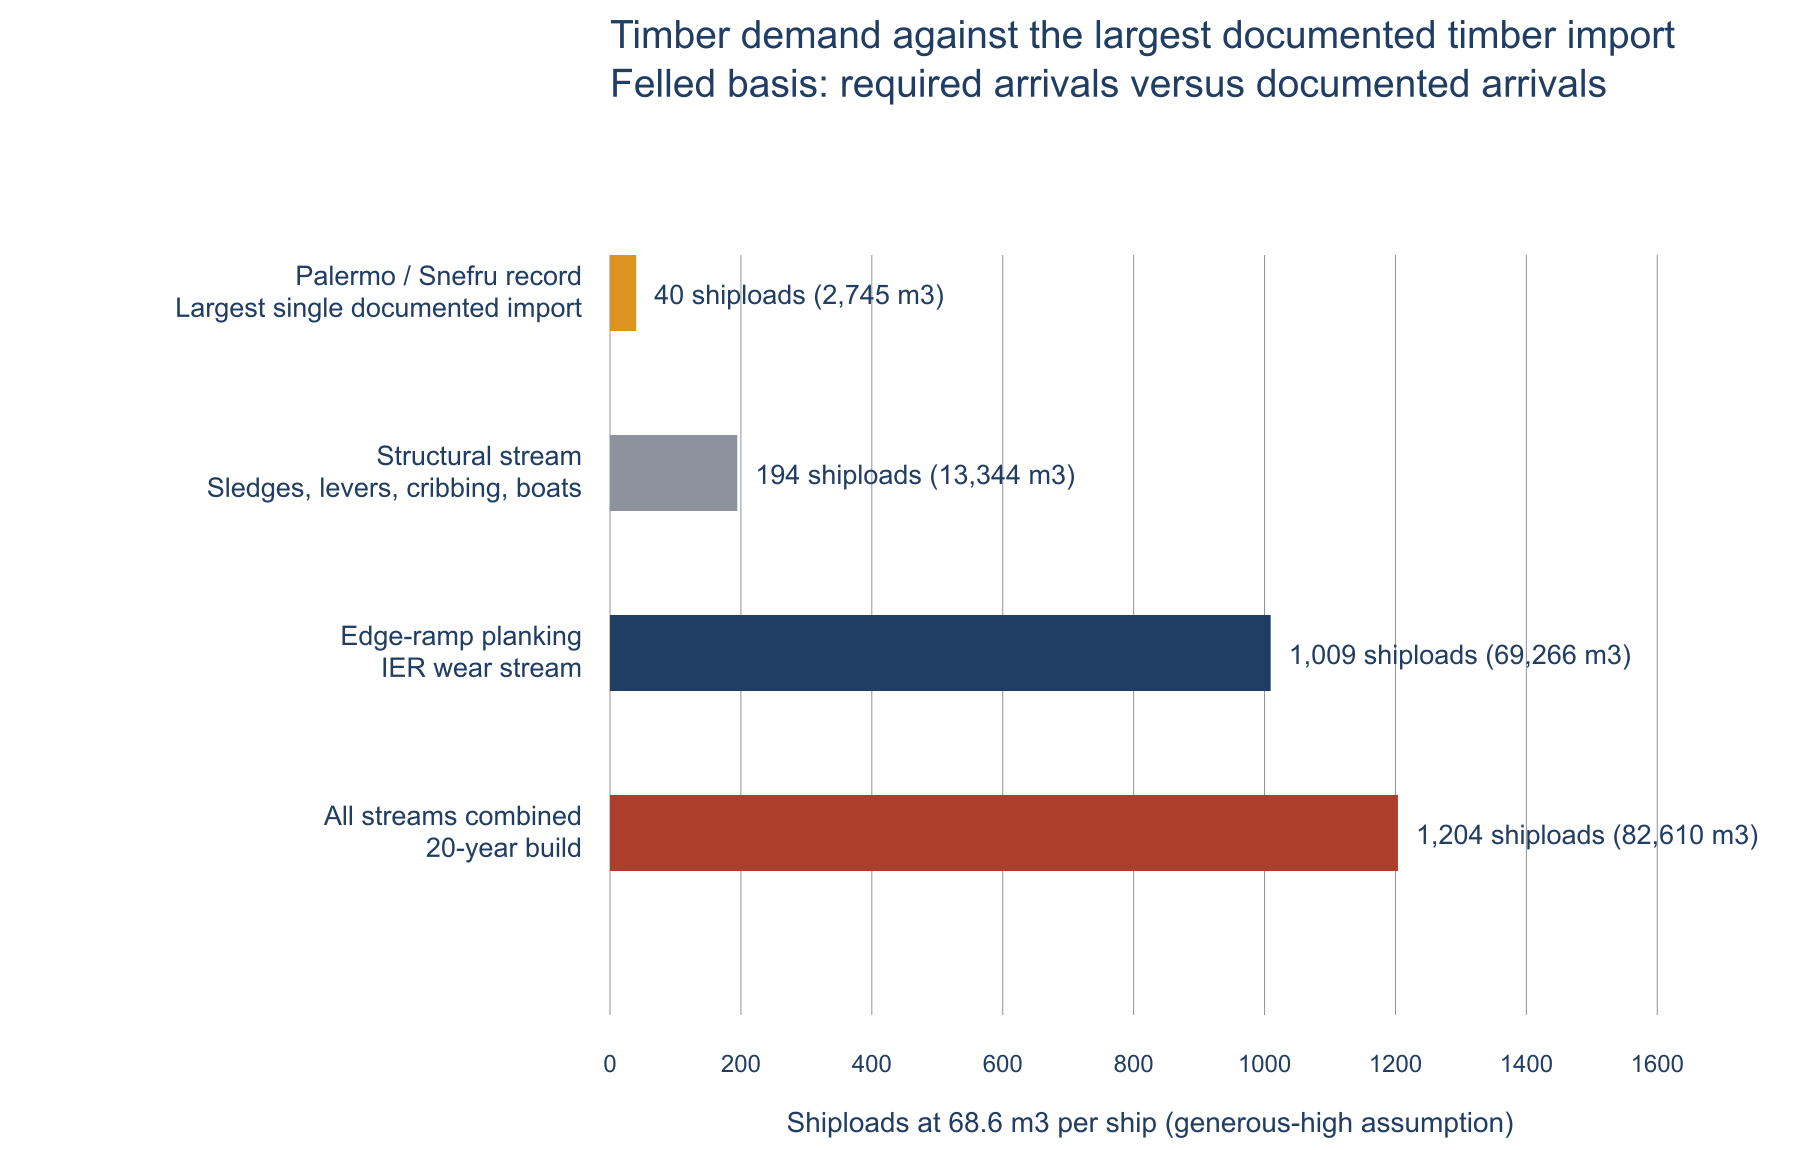
Figure 7. Timber demand against the largest documented single timber import of the period, expressed in shiploads; the operative unit where procurement is delivery-limited. Felled basis per ruling MR-07: the volume that must arrive, against the volume that did. Barge hull timber is excluded from the rollup.
10.1 Granite Transport and Transfer
The national closure test in Section 9.1 uses the sustained-rate burden. The granite operation adds a second, independent class of failure: not a rate, but peak-load transitions that exceed the tested physical limits. The conventional literature supplies no demonstrated mechanism that satisfies those limits. The King’s Chamber and its relieving chambers are roofed with roughly forty to fifty granite beams in the fifty-to-eighty-tonne class, quarried at Aswan and moved some 900 kilometers. Published conventional accounts commonly apply sled transport to ordinary limestone blocks, but provide no agreed method for the seventy-to-eighty-tonne granite.
The granite operation is now carried at two levels, and the distinction governs everything that follows. The heavy-load module covers thirty pieces at an eighty-tonne design mass, or 2,400 tonnes in all. It is a capability test: it asks whether one such piece can be moved at all, through overland pull, sled sustainment, ground bearing, vessel loading stability, restraint, and refloat. It is not the whole Aswan granite operation. Hemeda and Sonbol (2020) put the total granite brought from Aswan at 8,000 tonnes (Inputs_03!B204, SOURCED at Medium confidence: a stated figure in a geotechnical paper, unreferenced and underived, and repeated by Scheuring 2025 citing the same source rather than independently). The heavy-load subset sits inside that total, and the reconciliation is carried in the workbook where it can be read: 8,000 tonnes total equals the 2,400-tonne heavy subset plus at least 5,600 tonnes of remaining granite (GraniteAswan_42 rows 61-63). The remainder is a floor, because the thirty heavy pieces are priced at their eighty-tonne design maximum against a source range of twenty-five to eighty tonnes; the true remaining mass rises toward 7,250 tonnes as the actual heavy-piece mass falls.
The model prices each transition in the heavy-load chain and, where no mechanism is attested, prices the physical requirement rather than inventing a device. The results are reported as required capabilities:
| Granite transition | Requirement | Status |
|---|---|---|
| Overland haul, one beam | ~1,067 haulers on one rope | Rope train \>425 m on unimproved ground |
| Mid-route sled repair | Re-lift the beam | Same unattested 80 t lift |
| Transfer onto barge at Aswan, deck stability | 0.41 m deck-edge drop | 4.10x the transfer tolerance; same for end- and side-loading |
| Transfer onto barge, restraint | 24 t per beam | No attested mooring provision |
| Transfer off barge at Giza, ground bearing pressure | 8x pressure concentration | Exceeds delivery-end capacity; holds for any footprint below 5.33 m2 |
| Barge ground-out and refloat | 218 t laden vessel (MR-04) | No attested mechanism |
| Mobile expedition, one campaign | ~1,601 people | Priced and integrated (Wave 5), no families |
| River/harbor standing organization | 743 rostered | Priced and integrated (Wave 6), bodies only |
The transfer off the water at Giza is the decisive point. A beam resting flat imposes a modest ground pressure; a lifting device concentrates that same load onto a handful of point contacts, multiplying the pressure roughly eightfold, and at the delivery end it must do so on floodplain and harbor-basin ground. No attested Old Kingdom lifting device is rated for these loads, and the requirement exceeds the bearing capacity of soft saturated alluvium. The vessel can support the load in simple flotation, but the loading and unloading interfaces remain unresolved.
The scope of that test is stated exactly, because the two ends of the route do not share a substrate. Aswan sits at the First Cataract, where granite outcrops reach the banks, granite bedrock underlies the city and extends along the eastern bank at the quarry, and the floodplain is almost nonexistent. Soft saturated alluvium does not describe the loading end, so the bearing-pressure test makes no claim about it (ruling MR-03). The Aswan-end burden is unchanged in kind: it still requires an unattested lifting mechanism with defined geometry, and it remains governed by the haul, sustainment, and refloat gates. Proposed load-at-grade routes at the quarry, including the cut canal, inundation timing, and water-level control, are recorded as an open pricing task (SRC-GRANITE-LOADING-PROPOSALS) rather than treated as a resolved mechanism or dismissed. Giza is the floodplain end, and that is where the bearing-pressure test applies.
That finding does not rest on the assumed size of an unattested device. The model states it as a threshold instead. The break-even lifting footprint is the ground-contact area at which bearing pressure falls to the assumed delivery-end capacity. It is 5.33 square meters (SensitivityBreakEven_06!B11: beam mass Inputs_03!B187 over bank capacity Inputs_03!B194). The Gate 3 finding therefore holds for any lifting footprint below 5.33 square meters, whatever device is proposed. The model's working assumption is 1.5 square meters (Inputs_03!B169), so the footprint would have to grow by a factor of 3.56 for the gate to clear.
The threshold defines the physical requirement. A footprint of 5.33 square meters is 44 percent of the beam's own bearing face, roughly a 2.3 meter square pad of continuous solid contact, or four feet of 1.15 meters square each. Meeting the threshold would require continuous ground contact over nearly half the beam's bearing face while preserving sufficient clearance to lift and transfer it. Read in reverse, the same threshold means that the shore would have to bear 53,333 kilograms per square meter at the assumed 1.5 square meter footprint, rather than 15,000. The ground would have to be 3.56 times stronger than soft saturated alluvium at the point where it is wet.
The delivery-end capacity is levered and badged as an assumption. At 15,000 kilograms per square meter (about 147 kilopascals) it sits at the generous end of published soft-saturated-soil ranges, favorable to the conventional scenario. It carried no register entry until v0.71 and is now badged ASSUMPTION rather than SOURCED, with the citation task registered and open (SRC-BANK-BEARING). Two directions are worth stating. If a sourced capacity comes in lower than the assumed value, the break-even footprint rises and this finding strengthens. And if the Giza delivery point is shown to have been a built or prepared surface, such as a revetted quay or paved basin edge, then the delivery end is not soft alluvium either, and the test must be re-run against that surface. That is the stated reversal condition for the scoping ruling. Until a prepared Old Kingdom delivery surface is demonstrated, the failed gate stands.
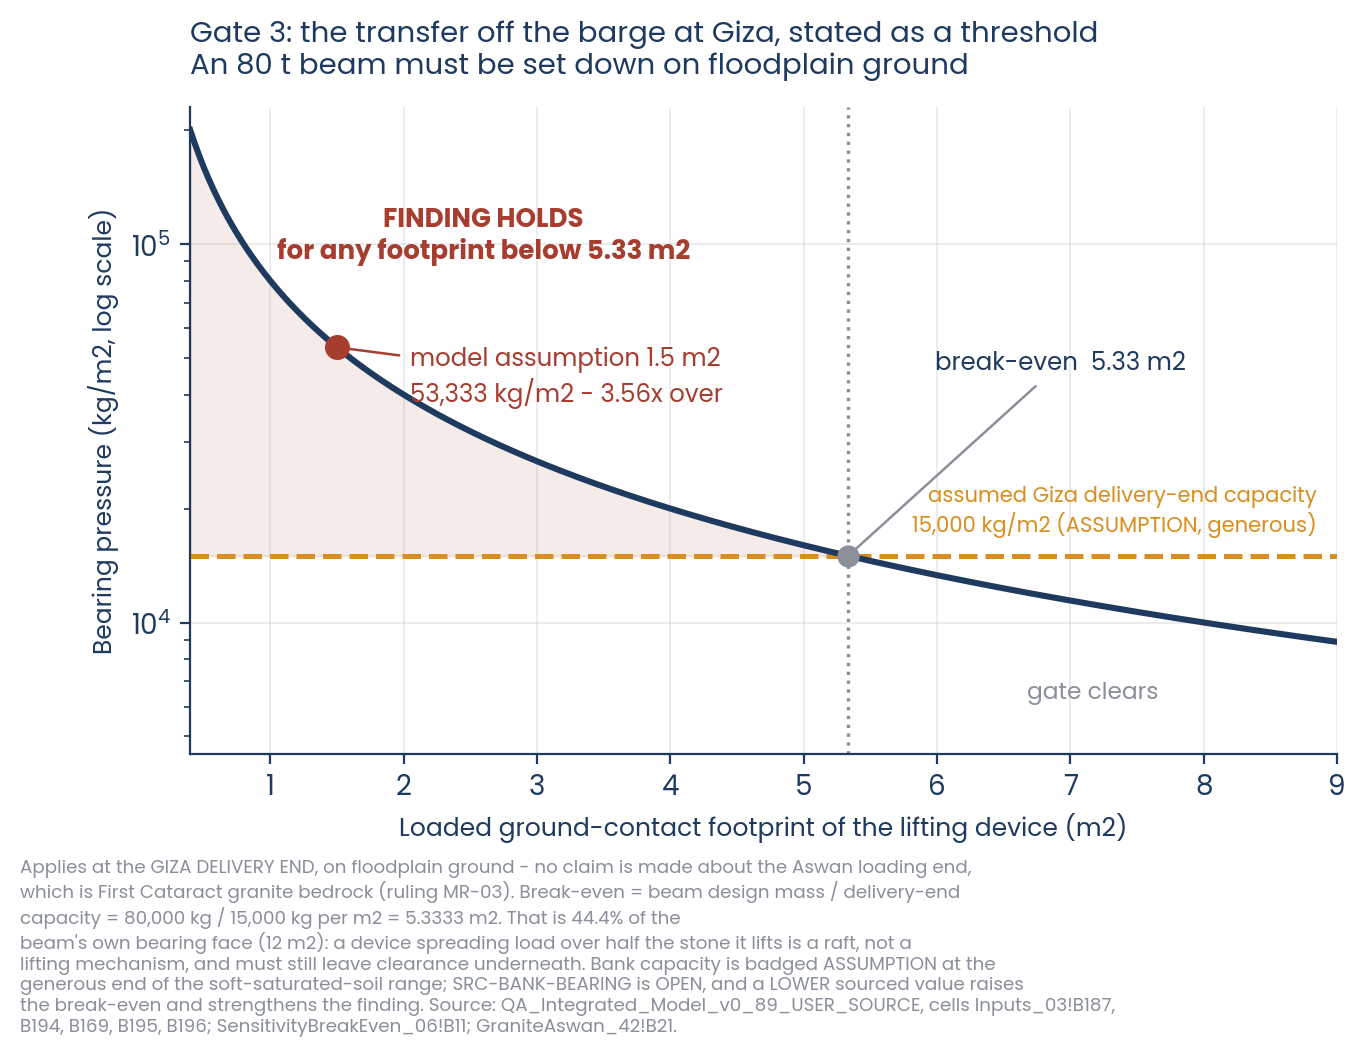
Figure 8. The Gate 3 threshold at the Giza delivery end. Bearing pressure falls as the lifting footprint grows; the finding holds anywhere the curve sits above the assumed delivery-end capacity. Break-even is 5.33 square meters, against a working assumption of 1.5. The test applies at Giza, on floodplain ground; no claim is made about the Aswan loading end, which is First Cataract granite bedrock (ruling MR-03). The capacity is an ASSUMPTION taken at the generous end of the soft-soil range, with its citation task open.
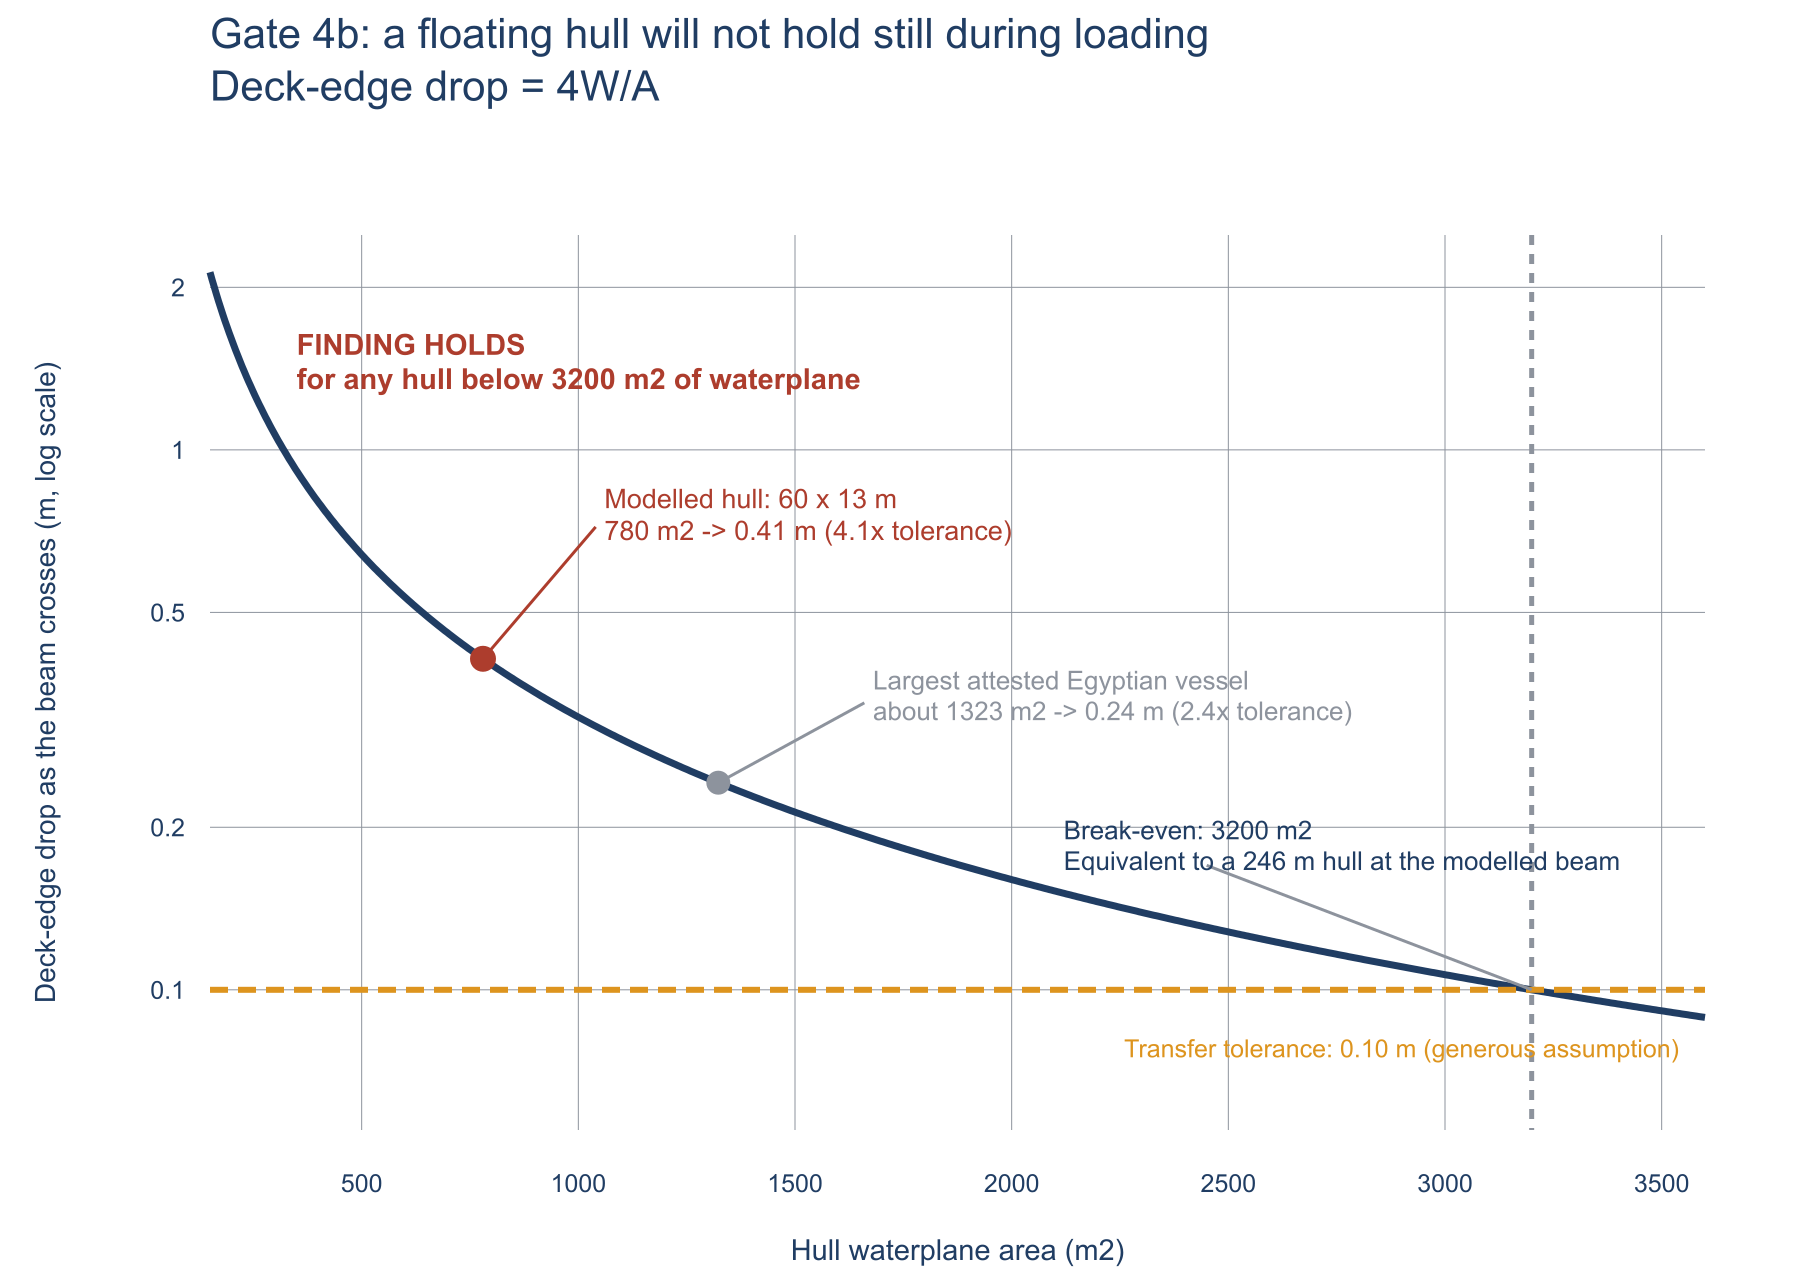
Figure 9. Deck-edge movement during transfer against hull waterplane area. The loading edge drops by four times the beam mass over the waterplane area, identically for end-loading and side-loading. On both the modeled hull and the largest attested Egyptian vessel, deck-edge movement exceeds the adopted 0.10 m tolerance. Meeting that tolerance requires a 3,200 square meter waterplane, equivalent to a 246 m hull at the modeled beam; no Egyptian vessel of that size is attested.
Setting the beam down is only half of the delivery problem. Getting it aboard in the first place is the other half, and a floating hull will not hold still for it.
A vessel floats by displacing its own weight. Put eighty tonnes on it and it must sink until it displaces eighty tonnes more, and because the load arrives at one edge rather than at the center, the hull also tilts toward that edge. Both effects move the same piece of deck, the edge the stone is crossing, in the same direction, downward, at the moment the stone is half on and half off. The arithmetic reduces to two terms. Parallel sinkage is the added weight over the waterplane area; the tilt contributes three times that at the loaded edge; and the two sum to four times the added weight divided by the waterplane area.
The result has two governing properties. First, it does not depend on how the beam is loaded. Pushing it on lengthwise over the bow or stern gives a trim, pushing it on sideways over the gunwale gives a heel, and the two derivations converge on the identical figure. Both loading orientations therefore return the same value. Second, it does not depend on the displacement of the vessel: the displacement term cancels, provided the far end of the hull stays in the water.
The modeled hull is sixty meters long and thirteen meters wide, an already generous assumption. The loading edge drops 0.41 meters (GraniteAswan_42!B48) as the beam comes aboard. Against a transfer tolerance of 0.10 meters, taken generous, that is 4.1 times over. The break-even threshold requires 3,200 square meters of waterplane (SensitivityBreakEven_06!B22), which at the modeled hull beam is a vessel 246 meters long. The largest attested Egyptian vessel of any period, the New Kingdom obelisk barge, is carried as a lever at 63 by 21 meters (Inputs_03!B200/B201), a waterplane of 1,323 square meters (GraniteAswan_42!B54), and on that hull the edge still drops 0.24 meters (GraniteAswan_42!B55), 2.42 times the tolerance (GraniteAswan_42!B56).
There is a third requirement that follows from the same operation and has no attested provision at all. Sliding eighty tonnes across a prepared deck takes about twenty-four tonnes of push, and by Newton's third law that force reacts against the hull, which is floating and therefore free to move. A vessel under slow horizontal load resists with essentially nothing. The mooring or grounding must absorb approximately 235 kilonewtons, or 24 tonnes-force (GraniteAswan_42!B53), during every beam transfer and must anchor that force into a wet riverbank. The friction basis is the wet-track coefficient (Inputs_03!B4), not the unimproved-ground figure, because a timber deck and a prepared ramp are prepared surfaces and the lower coefficient is the generous reading (ruling MR-05). The down-slope component once the deck tilts is excluded, a further conservatism.
The escape from all of this is to ground the vessel so it cannot sink, tilt, or slide. That is a real proposal and it is not dismissed here. But a grounded hull carrying 218 tonnes then bears on floodplain ground, which is the Gate 3 test applied to the vessel instead of the stone, and it has to come off the bottom afterward, which is the refloat gate that already records no attested mechanism. Float the hull and the transfer fails on stability and restraint; ground it and the same operation fails on bearing and refloat. Both routes are priced. Neither is open.
The barge itself is a further burden the conventional account does not enter. A vessel that floats an eighty-tonne beam together with its cradle, crew, and provisions, together with its own hull mass, must displace on the order of 220 tonnes, requiring roughly fifty-five tonnes of worked acacia per hull. Herodotus records that Egyptian cargo hulls were built of acacia: the same species the copper furnaces, bread ovens, mortar kilns, and now the barge fleet all draw on, in a country whose structural timber was imported. The excavated Khufu ship, at roughly 44 meters and over 1,200 planks, anchors the scale of large Egyptian hull construction as physical fact rather than extrapolation.
The heavy-load operation is conceded on generous terms; as a special mobile expedition with no resident families, priced as sequential rather than concurrent, and understated in beam count. The basis is stated exactly: a heavy-load subset of 30 major granite beams at an 80-tonne design mass, transported from Aswan to Giza (Inputs_03!B188). The relieving chambers alone are roofed with roughly forty to fifty granite beams, so the modeled thirty is generous-low by construction, and every heavy-load labor figure that follows is scaled to the smaller number.
The full 8,000-tonne mass is then priced as throughput on the sourced river schedule, using only work governed by mass and only where a sourced rate exists (GraniteAswan_42 rows 65-74). At one design-mass piece per voyage, 80 tonnes of granite using the same treatment as the heavy-load module (Inputs_03!B187), moving all Aswan granite requires 100 voyages against the 30 the heavy subset needs on its own, 70 additional voyages. The hull's other 21 tonnes of rigging, dunnage, crew and provisions is carried in the displacement sizing (BargeTimber_43!B9) and is not cargo. At the sourced Merer cadence, each round trip takes 45.5 days, the heavy-transport window lasts 150 days, and the fleet contains eight barges. The full mass requires 3.79 fleet-seasons, against 1.14 for the heavy subset. The finding is therefore more operating seasons and voyages on the same fleet, not more concurrent crews, unless the schedule is compressed; in which case it becomes concurrent barges and crews instead. Barge crew-days rise from 54,606 to 182,019 and campaign grain from 55 to 182 tonnes, within the provisions capacity the model already grants. The one-piece-per-voyage denominator is generous: smaller granite could in principle be combined to fill a voyage to the design mass, and the model neither assumes that nor prices the extra handling it would require. The 1,601-person heavy-beam crew is not scaled by mass; it is the peak force required to move one eighty-tonne piece, and it does not multiply with tonnage.
Three burdens on the remaining mass are stated as unpriced rather than filled. Quarry extraction, quarry-to-river and Giza-side haul, and loading and unloading of the 5,600-plus tonnes are all mass-governed and would only add to the result, but no granite-specific productivity rate exists in the model: the quarry module's rates are limestone, and the model does not apply limestone rates to granite without technical support. Granite shaping, surface dressing, fitting, setting, joint preparation, and their copper-tool wear are excluded outright, because they depend on worked face area, component geometry, number of placements, and finish standard, none of which the sources supply; no component inventory, worked-area figure, or area-per-tonne relationship is available, and the model does not invent one. Every one of these would raise the granite burden. The omissions are conservative and are stated. Ruling MR-14. As of Wave 5 the expedition corps enters M3 as 2,783 rostered bodies with no family multiplier, and the barge fleet's felled acacia feeds the timber labor chain (felling, sawing, and overhead only; the cedar-import voyage and Giza overland haul lines are excluded because the hulls are native acacia built at riverside yards, a generous exclusion). Integration prices the bodies; it does not resolve the mechanisms. The operation still returns a chain of transitions with no demonstrated mechanism, each of which must succeed for a single beam to arrive; thirty times on the modeled subset, and roughly forty to fifty times in the structure as built; early in the build when the limestone haul is already at peak.
As of Wave 6 the river corridor itself is priced (workbook sheet RiverHarbor_47). The documentary anchor, the Diary of Merer, records 40-man phyles organized into roughly 200-man gangs running two to three round trips per ten-day week between Tura and Giza, and names the harbor basin (Ro-She Khufu) and its director (Ankh-haf). The model scales that documented operation to the Aswan corridor: roughly 900 kilometers each way, about 1,800 kilometers for a round trip, carried as a workbook lever at 890 kilometers (Inputs_03!B193). The prose figure is deliberately rounded: the Nile branch serving Giza ran closer to the pyramid complex in the Old Kingdom and the course has shifted since, so reporting the ancient navigable distance to the kilometer would imply more geographic precision than the evidence supports. On that corridor a laden round trip takes roughly 46 days, a barge completes about 3.3 trips per 150-day navigable season, and the 30 large pieces require about 1.14 barge-seasons of fleet time. The schedule is feasible on paper. The schedule result does not remove the burden. The governing requirement is the standing organization the voyages require; 557 rostered barge crew, 140 harbor and dock gang at both ends, 46 pilotage including the cataract detail, 743 rostered in total, entering M3 as bodies only with no family multiplier. Transit water is conceded Nile-direct at zero carrier burden, and en-route provisioning is conceded small: about 55 tonnes of grain over the campaign against roughly 300 tonnes of fleet capacity. Corridor support is now priced. Gates 1 through 4, including the shore lift, the ground-out and refloat, the mid-route repair, and the overland rope train, remain failed capability gates with stated reversal conditions, not corridor findings (Finding F26). One sourcing argument is pre-answered on the sheet: crewing the barges with soldiers changes nothing, because soldiers are drawn from the same prime-age cohort and the closure numerator counts bodies regardless of which state department supplies them.
10.2 Total Timber Demand and the Delivery Constraint
The timber case is usually reported in cubic meters, but delivery capacity is the governing constraint. This section follows the chain from procurement through replacement.
Egypt has no structural softwood stand. Cedar is imported. In a territory with no local supply, procurement is limited by delivery capacity, not by material volume. The binding question is not how much timber exists but how many hulls can be put on the route and how often they can complete the voyage. The ship, not the cubic meter, is the operative unit.
The chain runs as follows. A tree is felled. Some of the log is lost in transit and storage; breakage, rot, river soak, all of it hand-loaded and hand-discharged across hundreds of kilometers of open water. What survives is converted into usable members, and a share of that is rejected for species, dimension, or defect. What remains goes into service and wears out. The model applies that stack at 35% conversion loss, 25% structural reject, 10% handling and transport loss, and 12% water damage, for a combined usable yield of 38.61% (Inputs_03!B142/B143/B144/B176). Every one of those losses sits downstream of delivery: Inputs_03!B142 prices the conversion of "rough-log or imported beam volume to usable structural member," so imported material carries the same conversion burden as domestic stock after it arrives.
The consequence is that the volume the project must have delivered is the felled volume, not the installed volume. Across all streams that is 4,130.5 cubic meters per year (TimberLabor_40!B7), or 82,609.5 cubic meters over a 20-year build.
The comparator is the Palermo Stone entry recording forty ships of cedar under Snefru, the largest single documented timber import of the period (Inputs_03!B146, 2,745 m3 at a generous-high 68.6 m3 per ship, badged ASSUMPTION. A lower per-ship volume raises the ship count, so the published figure is the conservative end). Expressed in the operative comparison unit, total timber throughput is 60.2 Snefru-ship equivalents per year (TimberLabor_40!B29), every year, for twenty years; 1.50 times that entire recorded delivery annually (TimberLabor_40!B32), and 1,204 shiploads over the build (TimberLabor_40!B30), which is 1,164 beyond the record itself (TimberLabor_40!B33). All of it is computed live from the annual rollup; the per-ship volume is a Dashboard lever (Inputs_03!B202) and a lower value raises every figure, so the published counts are the conservative end.
The threshold form is the sharper statement. For a single forty-ship delivery to cover one year of demand, each ship would have to carry 103.3 cubic meters (SensitivityBreakEven_06!B28) against the 68.6 already assumed on the generous side. The finding therefore holds for any per-ship volume below 103.3 cubic meters. A critic may propose larger hulls, but the requirement remains unmet below the stated threshold.
Those figures measure total timber throughput in units of the recorded delivery. They are not a literal cedar-import claim, and the model reports the literal figure separately: at the 50% imported share the seaborne requirement is 30.09 cedar shiploads a year (TimberLabor_40!B48), which is 0.75 times the record annually, and 601.9 over the build (B50), 15.05 times the record. The annual literal requirement therefore sits below the recorded delivery while the build-long requirement exceeds it fifteenfold. Both are reported under ruling MR-10; neither is chosen after the fact.
The comparator is built the way the record is written. The Palermo entry states a number of ships, so the ship count is the sourced quantity (Inputs_03!B203, forty) and it is held fixed; the per-ship volume is the assumption (Inputs_03!B202), and the comparator volume follows as count multiplied by volume. Until v0.79 the workbook derived the ship count from the volume instead, which locked the two together: lowering the per-ship figure raised the model's own record above forty and left the headline multiple algebraically unchanged. The correction was made before the figure was placed on a public interactive, and it is recorded as ruling MR-06.
One sensitivity is reported rather than buried, because it cuts against the annual form of this finding. The plank service-life lever (Inputs_03!B192) doubles effective plank life under its steelman setting, which halves the ramp stream. Total demand falls to 2,398.8 cubic meters a year (TimberLabor_40!B38) and the annual requirement to 34.96 shiploads (TimberLabor_40!B39); below the forty-ship record, at 0.87 times it (TimberLabor_40!B40). The build-long requirement survives comfortably: 699.1 shiploads (TimberLabor_40!B42), 17.48 times the record (TimberLabor_40!B43). So the annual comparison is the sharper statement at the model's own settings and the build-long comparison is the one that holds under the most generous reading of plank reuse. Both are reported here; neither is selected after the fact.
This comparison measures magnitude, not a ceiling. The forty-ship record is the largest single documented import, not a cap on Egyptian import capacity; cedar moved from the Levantine coast to Egypt for centuries. The finding is the scale of the sustained requirement against the largest delivery the record actually attests.
One omission in the woodland ledger is stated rather than left to be found. The fuel-wood demand carried there is copper smelting and oven and brewery fuel only; mortar and gypsum firing is not quantified anywhere in the model, although it draws on the same species. The managed woodland figure therefore understates the requirement, which runs in the conventional account's favor, and pricing it is an open task (WoodFuelCredit_44, rows 29 to 30).
Native species are priced, not assumed away. The imported share is levered at 50% (Inputs_03!B180); the native acacia balance is carried against the woodland ledger with competing draws from copper furnaces, bread ovens, mortar kilns and the barge fleet (Section 10.3). Native stock does not resolve structural grade, which is the reason the imported share exists in the first place.
One further condition is badged UNATTESTED rather than disproven. The Palermo entry records ships of cedar wood; it does not specify processing state. Any treatment that credits pre-shipment conversion, meaning cedar arriving already squared, graded, or dimensioned; adds a condition the source does not contain, and must supply the source-side conversion capacity that condition implies. No such installation is reported in the sources surveyed to date, and the primary reading task remains open (SRC-CEDAR-PROCESSING-STATE). Two qualifications are recorded with it: the Report of Wenamun describes Byblos supplying timber shaped as stem-posts and keels, but that text is New Kingdom, roughly 1,500 years after Khufu and a different political era, and the reading of the relevant Palermo count is itself contested in the literature. This condition is the stated reversal test for ruling MR-07.
10.3 Timber Waste and the Wood-Fuel Ledger
Timber enters the model as three streams: structural stock (sledges, levers, cribbing, planking), the edge-ramp planking of Section 7.13, and the granite barge fleet. Each is loaded with the same waste stack: conversion loss, unsuitable stock, handling loss, and water damage. The felled volume, not the installed volume, therefore drives the labor and land burden (ruling MR-07, MethodsRulings_48). WoodFuelCredit_44 converts the structural and edge-ramp streams from cubic meters to tonnes at the governed density and adds the barge-hull stream on its governed basis. The corrected v0.92 ledger returns approximately 2,947.8 tonnes per year of gross timber throughput. The former cubic-meter/tonne inconsistency is resolved.
Timber waste is not discarded; cutoffs, sawdust, and spoiled stock are fuel. The model credits a generous three-quarters of all timber waste against the fuel-wood demand already carried by the smelting, baking, and mortar operations, capped so the credit can never exceed actual demand. This pre-empts a double-counting objection: the waste is explicitly burned. But the credit covers only about 3.7% of a fuel-wood demand approaching 53,000 tonnes per year. Netting every burnable scrap, total acacia felled, including structural timber and net fuel wood, is on the order of 55,000 tonnes per year, implying roughly 2,200 square kilometers of managed woodland. The waste credit closes the loophole without closing the woodland gap, on the one sacred, imported-scarce species every wood-consuming department competes for.
11. Concessions to the Conventional Scenario
The model grants several assumptions favorable to the conventional scenario, including the standard scholarly population anchor with sensitivity to higher estimates (2.0M and 2.5M, which lower the share and favor the conventional scenario), an adjusted effective labor pool, a bounded youth light-support credit, and control layers that allow future alternatives to reduce burdens if they are cost-loaded. v0.38 also corrected annual-yield farmers to roster factor 1.0, lowering the headline M3 burden in favor of the conventional model. Several pending operations are not yet integrated into M3, which means the current headline burden is not a maximum.
The full concession set is broader than the population denominator, and several concessions were paid in both directions. Workforce entry at age 15 grants full adult output and simultaneously widens the effective labor pool from 3,000 to 4,200. Worker replacement is derived from cemetery mortality only, with disabling injury excluded despite a documented 67% healed-fracture rate, and the median age at death is taken at the midpoint of the sourced range rather than at the endpoint most favorable to the audit. All calories are priced as grain, the cheapest calorie; the documented cattle and fish diet would cost more land and labor. Track-wetting water is charged to loaded lanes only, with return lanes run dry. Water carriers receive a 0.75 work-rest factor against the haulers’ 0.20 duty cycle. Copper recycling is assumed complete except unrecoverable filings. Workforce availability is floored at modern regional labor practice, using a 10-hour, six-day calendar. And the v0.38 farmer-roster correction was applied specifically because the prior treatment overstated the burden.
The published cumulative-roster basis overstates daily consumption, but the corrected-basis test leaves every verdict unchanged (ruling MR-21). The model applies daily rates of 10 liters of domestic and process water per person, 3,000 kcal per laborer, and 1,800 kcal per dependent. In the published calculation, those rates are applied to populations derived from the cumulative roster, which counts every distinct individual who passes through a post during the build, including replacements for men who die or age out. The standing population on any one day is smaller, so the published population-derived consumption burden is overstated.
This was measured before it was ruled. Two recalculated derivatives take the settlement overshoot from 11.27x to 9.86x and then 8.35x, and reduce the broader project-population figure from 533,234 to 403,746. These values are recorded in MethodsRulings_48!E49 rather than live v0.92 output cells. The labor, demographic, and settlement findings survive both derivatives. National closure still exceeds the mobilization ceiling, demographic closure still does not close, and village sufficiency stays WITHIN RATIO. The material and capability findings in timber, copper, rope, and granite transfer are governed by production rates and physical thresholds that the counting basis does not affect. The published basis was retained for continuity because the findings do not depend on it. The leaner basis remains available, and the paper's conclusions do not change.
The purpose of these concessions is methodological. The conventional model should be allowed every reasonable opportunity to close. If it still does not close under favorable conditions, the finding is stronger.
12. Closure Requirements and Adversarial Tests
A construction explanation closes only if it preserves all required functions. If a reviewer objects to an input, the model invites that objection. But the reviewer must show how the changed input affects the full system.
| Adversarial move | Model response |
|---|---|
| Reduce water carriers | Identify the replacement delivery system and cost-load labor, materials, maintenance, containers, feedback, and evidence. |
| Use youth help | Apply bounded intermittent credit unless youth are modeled as a standing labor department with productivity, supervision, work water, fatigue, and household opportunity cost. |
| Use canals, wells, boats, animals, or depots | Treat as replacement systems, not free deletions. |
| Use ramps | Define geometry, material volume, route capacity, maintenance, phasing, and removal/rework. |
| Move production off-site | Keep the output project-dedicated and prevent double-spending in the non-project economy. |
| Increase productivity or extend schedule | Update direct cadence and support loops; verify whether food, water, replacement, and state capacity improve or simply shift. |
| Dismiss the 150k screen | Use the full capacity-band table. The current M3 result sits above its top band (500k, kingdom-scale reorganization). |
| Import foreign labor | Lever exists (v0.62, DEFAULT 0; the conventional account assigns the workforce to Egypt). Imported labor shifts only the pool draw; food, water, housing, and population burdens are nationality-invariant. The documented record (Weni) shows episodic auxiliaries, never decades of sustained foreign labor. |
| Flip, down-grade, and reuse worn planks | Lever exists (v0.62, STEELMAN 2.0x effective service life). Fuel down-cycling is already credited at 75% and capped at actual fuel demand. The binding constraint is structural-grade extraction rate, which the multiplier prices directly, and the woodland gap survives it. |
| Raise the 25% mobilization ceiling | Lever exists (ClosureSensitivity_45 B5, wired into the national closure verdict cells in v0.65). The ceiling is an ASSUMPTION, set at the top of the 10-25% preindustrial band, and it is the one input whose movement could reverse Test 1 by itself. Move it and the workbook reports the result without argument. But the size of the move matters and is often misstated. Documenting a pre-modern state that sustained more than a quarter of its non-farm labor on a single construction program challenges the calibration of the ceiling; it does not reverse the verdict. The measured demand is 61.6% on the corrected concurrent basis (MR-08). A documented case at 35% or 40% moves the ceiling and leaves the project at roughly one and a half to two times the revised figure. To reverse Test 1 on this lever alone, the demonstrated sustained share must approach 61.6% on the corrected concurrent basis. The ceiling would have to more than double while the same state still funds army, temples, administration, trade, and other construction. |
| Haul the beams overland the whole way instead | Does not resolve the failed loading interface; it only shortens it. Giza lies west of the Nile, and the Aswan granite sources and their transport quays are associated with the river corridor. Any land-dominant route must still demonstrate how a 50-to-80-tonne member reached the west-bank plateau without a heavy-load transfer onto and off a floating vessel, the transfer that fails at any lifting footprint below 5.33 m2 (F28) and any hull below 3,200 m2 of waterplane (F29). Reducing the voyage from ~900 km to a river crossing changes the duration of the floating leg; it does not remove the requirement to load the beam onto a floating vessel. The model does not price a 1,800 km overland haul because no published conventional account proposes one. Any proposed rescue must supply a credible dry route to the west-bank plateau that avoids the heavy-load water transfer. This test does not depend on a specific reconstruction of Old Kingdom channel positions. |
| Crew the barges and harbors with the army | Changes nothing. Soldiers are drawn from the same prime-age cohort; the closure numerator counts bodies regardless of which state department supplies them. An army standing crew duty on the Great Pyramid supply corridor for decades is not garrisoning borders or fielding campaigns, and the Weni comparator already prices what the kingdom could mobilize and for how long. |
| Add women to the denominator | The Test 1 numerator is built from modeled male labor categories. The denominator is therefore the matching male cohort. Adding women to the denominator without adding or reclassifying the numerator is not a like-for-like widening; it widens the pool while leaving the demand male-scoped. Female labor in household support, caregiving, textile production, milling, brewing, food processing and other economic functions was not idle capacity waiting to be reassigned; it was output the kingdom depended on. Reassigning it does not create free labor; it creates replacement burdens, and replacement burdens must be cost-loaded like any other replacement system. Female-assigned support already embedded in household ratios and in the diagnostic modules must not be counted a second time. A reviewer who wants women in the denominator must name the numerator categories that become female, price the replacement of the functions vacated, and clear the double-count. Once those changes are specified, the workbook can calculate the revised result. |
13. Pending Operations, Diagnostic Matrix, and Exclusions
The following functions remain pending, partial, controlled/open, or diagnostic-only in the current release. Their absence from the main M3 total should not be misread as evidence that they are unnecessary. DiagnosticIntegration_35 now governs whether these first-order diagnostic burdens can enter M3.
| Function | Current status | Why it matters |
|---|---|---|
| Food method selection | RULED (v0.60 / v1.5) | Direct-cropland lower-bound is the headline; the feedback-solved loop is published as the named ceiling (~1,603,797, 100.2% of kingdom; Section 7.3). The method decision is closed. |
| Sanitation/medical support | First-order diagnostic / not M3-ready | Waste, cleaning, injury care, and support labor scale with village population; rates, materials, and feedback remain open. |
| Processing/fuel/containers | First-order diagnostic / non-additive risk | Water, grain, and fuel require handling, storage, containers, breakage reserve, and labor; double-count control remains essential. |
| Shaping/setting/casing/rework | Integrated (Wave 1) | LABOR INTEGRATED (Wave 1): final shaping, setting, casing and rework labor is priced at the base screen and integrated. The additional shaping/setting copper-tool demand (1.3797 t/yr, ShapingSetting_33!B66) and the timber-support diagnostics are NOT integrated into M3. |
| Structural timber | Material screen control-only; labor integrated (Wave 3) | Sledges, planks, anchors, levers, cribbing, boats, and repair stock have a stock/replacement screen; the implied labor enters M3 via TimberLabor_40. |
| Ramp construction/maintenance/removal | Integrated (Wave 4) | Route system construction, maintenance, and removal crews are priced and integrated; surface and phasing levers remain open. |
| Aswan granite expedition | Integrated (Wave 5, bodies only) | Expedition corps and barge-timber feed are priced and loaded; shore-lift, refloat, and mid-route repair capability gaps remain findings; corridor support is priced separately (Wave 6). |
| River / harbor leg | Integrated (Wave 6, bodies only) | Barge crews, harbor gangs, and pilotage over the 890 km corridor are priced and loaded (RiverHarbor_47, Merer-anchored); en-route provisioning conceded small; Gates 1-4 remain capability findings. |
| Administration/security | Pending | Large system requires measurement, accounting, supervision, storage control, guards, and conflict management. |
| Lighting/night work | Pending | Night operations require lamps, fuel, wicks, safety, supervision, and rest-cycle effects. |
14. Findings Register
This register states the audit's governing findings, their status, and the evidence required to reverse them. Detailed derivations appear in Sections 7 through 10. The findings are simultaneous rather than alternative: a proposed construction system must clear every failed gate while preserving the functions already priced elsewhere in the model.
F24 National labor closure. Ex-farmer project labor stands at 61.6% of the non-farm male labor pool, 2.5 times the single-project mobilization benchmark.
Status: integrated into M3.
Test 1 excludes the 46,350 rostered annual-yield farmers because Test 2 prices their land, households, and surplus draw. On the dimensionally consistent concurrent-to-standing basis required by MR-08, the ex-farmer share is 61.6%. The former 70.4% rostered-to-standing figure and the inclusive 130.8% figure remain labeled transparency lines. At the sourced 1.6 million population anchor, all 30 sensitivity cells remain above the 25% benchmark. Reversal requires a sourced Old Kingdom demographic configuration that produces a sufficient non-farm pool or evidence that the state could sustain a single-project commitment near 61.6% while continuing its other functions. See Section 9.1.
F25 Demographic duration. The project requires mobilization at roughly 0.95 times the largest documented Old Kingdom levy, held continuously for the full build rather than raised once and disbanded.
Status: integrated into M3, verdict layer.
The ex-farmer standing force keeps 12.3% of the national prime-age male cohort continuously absent and requires 2,705 additional prime-age men to enter the workforce each year. MR-09 requires the concurrent basis because Weni's levy was a one-time mobilization. Across the sourced cemetery mortality range, the comparison runs from 0.825 to 1.140 times the levy; the rostered 1.08 comparison remains a transparency line. The finding concerns sustained posture, not an unconditional arithmetic exceedance. Reversal requires evidence of an Old Kingdom state maintaining levy-scale mobilization continuously for decades. See Section 9.2.
F26 River and harbor corridor. The Aswan-Giza corridor is feasible on the modeled schedule and is integrated at 743 rostered workers.
Status: integrated into M3, Wave 6 bodies only.
Barge crews, harbor gangs at both ends, and pilotage enter M3 as bodies, anchored to the Diary of Merer. The thirty-piece heavy-load schedule requires about 1.14 barge-seasons. This finding prices the standing organization; it does not clear the separate granite loading, shore-transfer, restraint, bearing, and refloat gates in Findings F28 and F29. See Sections 7.8 and 10.1.
F27 Timber demand. Total structural timber throughput equals 1.50 times the largest documented single timber import each year and 30.09 times that import over the twenty-year build.
Status: quantified burden. Timber labor is integrated through TimberLabor_40, Wave 3; the material screen remains control-only.
The all-streams requirement is 4,130.5 cubic meters a year and 82,609.5 cubic meters over the build, expressed in Snefru-ship equivalents. Under the model's 50% native-timber concession, the literal imported-cedar requirement is 0.75 times the recorded delivery annually and 15.05 times over the build. A forty-ship annual delivery breaks even only at 103.26 cubic meters per ship, above the model's generous-high 68.625 cubic meter assumption. At the doubled plank-service-life steelman, the annual equivalent falls to 0.87 times the record, but the build-long requirement remains 17.48 times it. Reversal requires a supported reduction in the timber requirement, delivery at the required sustained rate, or use-class evidence showing that native supply can meet the structural uses now assigned to the combined stream. SRC-TIMBER-USECLASS and SRC-CEDAR-PROCESSING-STATE remain open. See Sections 7.6, 7.13, and 10.2.
F28 Granite transfer at Giza. The Gate 3 bearing-pressure finding holds for every lifting footprint below 5.33 square meters at the delivery end.
Status: capability gap stated as a break-even threshold. Granite-corps labor is integrated through Wave 5 bodies only.
The model's working footprint is 1.5 square meters, so it must grow by a factor of 3.56 to reach the threshold. The break-even is 44% of the beam's approximate 12 square meter bearing face. Meeting it would require continuous ground contact over nearly half that face while preserving enough clearance to lift and transfer the beam. At the working footprint, the shore must bear 53,333 kilograms per square meter rather than the assumed 15,000. Reversal requires a loaded footprint of at least 5.33 square meters, a higher supported bearing capacity, or evidence of a built or prepared Giza delivery surface. The test makes no claim about the Aswan loading end. SRC-BANK-BEARING remains open. See Section 10.1.
F29 Granite transfer stability. Moving an eighty-tonne beam onto the modeled floating hull lowers the loading edge by 0.41 meters, 4.10 times the adopted tolerance.
Status: capability gap stated as a break-even threshold. Not in M3.
End-loading and side-loading both reduce to the same result. Holding the deck edge within 0.10 meters requires a 3,200 square meter waterplane, equivalent to a 246 meter hull at the modeled beam. The largest attested Egyptian-vessel comparator has a 1,323 square meter waterplane and still drops 0.242 meters, 2.42 times the tolerance. Mooring or grounding must also absorb approximately 235 kilonewtons, or 24 tonnes-force, during each beam transfer. Reversal requires a hull above the break-even, a transfer method that does not move the beam across a floating deck edge, or a demonstrated restraint and refloat system that clears the related gates. SRC-BARGE-DIMENSIONS remains open. See Section 10.1.
F30 Rope and fiber. The modeled system requires 567.2 tonnes of finished rope each year, equivalent to 17.45 complete first-rate warship riggings annually, or one every 2.98 weeks for the full build.
Status: quantified diagnostic. Plant, fiber, and production labor is carried in the integrated workforce and population ledgers; the material chain remains diagnostic.
The active system holds 13,230 meters of rope and 15,214.5 meters with staged spares. Replacement and production losses raise annual output to 872.7 kilometers and 567.2 tonnes. Upstream calculations require 667.3 tonnes of prepared fiber, 2,224.4 tonnes of raw harvest, and 1,601.6 hectares of dedicated fiber cropland. Those upstream results sit behind more assumptions than the sourced first-rate rigging comparison and are reported at lower confidence. The Chatham rope-yard comparison remains secondary because its 1798 workforce attribution is unverified. Reversal requires a supported lower rope-consumption rate, longer service life under the modeled loads, or demonstrated material and production capacity at the required rate. SRC-ROPE-CHATHAM remains open. See Section 7.9.
F31 Copper supply. Annual quarry-tool copper demand is 7.16 times the long-run average output of the largest known Sinai source, and one build draws 11.01% of that source's all-time output.
Status: quantified diagnostic. Quarry copper-chain labor is carried in M3; the supply chain and woodland consequence remain diagnostic.
The quarry chain requires 27.54 tonnes of new copper production each year and 550.7 tonnes over the build, equivalent to about 143 years of Bir Nasib production at its long-run average rate. The comparator is generous because the all-time output is dominated by production roughly a millennium after Khufu. The additional shaping, fitting, setting, casing, and rework copper demand of 1.3797 tonnes a year is excluded from this comparison. The 110.1 square kilometer smelting-woodland footprint is a consequence of lower-confidence assumption levers rather than a co-headline. Reversal requires a supported reduction in copper demand or an ore and smelting source capable of sustaining the required output. See Sections 7.10 and 10.3.
15. Limitations and Remaining Work
The audit is complete for the findings reported in this paper, but the model boundary is not a claim that every possible project burden has been integrated into M3. M3 is the current labor-and-settlement total. Several material screens and physical-capability findings are governed separately, and some required functions remain diagnostic or pending. Those items may add burden. They do not suspend or reverse a returned finding unless the applicable reversal condition is satisfied.
The audit tests the conventional construction explanation. It does not identify the builder, date an alternative construction event, or propose a replacement method. Its comparisons also inherit the confidence and scope of their sources. Where an input is an assumption, a later-period comparator, or an unresolved attribution, the paper and workbook identify it as such.
The published M3 figure uses the cumulative-roster consumption basis. MR-21 records a corrected-basis derivative at 403,746 people and an 8.35 times settlement overshoot. Those derivative values are recorded in the ruling rather than in live v0.92 output cells. The labor, demographic, and settlement findings survive the correction; the material and physical findings are unaffected by it.
| Remaining item | Required resolution or treatment |
|---|---|
| Food-feedback reconciliation | Reconcile the feedback-solved off-site basis through Integration Waves 3 through 6. Until then, the direct-cropland lower bound remains the M3 headline and approximately 1,603,797 remains the named, unreconciled ceiling. |
| Sanitation, medical care, processing, fuel, and containers | Complete productivity, material, person-category, feedback, and double-count controls before any additional burden enters M3. |
| Administration, security, and lighting | Quantify the remaining labor, fuel, material, supervision, and rest-cycle effects or document their exclusion. |
| Prime-age male cohort basis | Harden SRC-MALE-COHORT to a published model life table or an Old Kingdom demographic estimate. The current 24% lever remains a disclosed assumption with a 20% to 30% sensitivity range. |
| Weni and Palermo source pins | Complete the remaining primary-page verification for the Weni mobilization comparator and the Palermo military-context entry. |
| Timber use classes and cedar processing | Resolve SRC-TIMBER-USECLASS and SRC-CEDAR-PROCESSING-STATE, including the division between imported structural-grade stock and suitable native uses. |
| Giza delivery surface | Harden SRC-BANK-BEARING and determine whether the delivery point was soft alluvium or a built or prepared bearing surface. |
| Heavy-cargo hull evidence | Resolve SRC-BARGE-DIMENSIONS with attested Old Kingdom dimensions or a better-supported comparator. |
| Aswan loading route | Price the proposed load-at-grade routes, canal access, inundation timing, and water-level control under SRC-GRANITE-LOADING-PROPOSALS. |
| Rope-yard attribution | Complete the primary-source check for the 1798 Chatham workforce figure under SRC-ROPE-CHATHAM. The sourced first-rate rigging comparison remains the reportable rope finding. |
DiagnosticIntegration_35 governs whether an open module is ready to enter M3. Entry requires stable productivity, a defined material basis, consistent person categories, support feedback, and explicit double-count controls. Until those requirements are met, the module remains visible without being added to a headline total.
Appendix A. Current Model Tables
Rows in this table carry different status. HEADLINE rows are the model's claims. DIAGNOSTIC rows are single-module screens and are not additive into a headline total. TRANSPARENCY rows are published for completeness and are explicitly not the claim. Where a row's scope is narrower than its name suggests, the scope is stated in the row itself. Any figure not in this table is either a diagnostic reported in its own section or a superseded value from Appendix C.
| Metric | Value |
|---|---|
| Current M3 project-dedicated population | 533,234 |
| Current share of 1.6M comparator | 33.33% |
| Capacity-band position | Above the 500k band (top of table) |
| Secondary ratio vs 150k screen | 3.55x |
| On-site rostered workers | 47,316 |
| Implied on-site village population | 281,643 |
| Off-site project-dedicated population | 250,848 |
| River/harbor standing organization (Wave 6, bodies only) | 743 |
| Integrated Giza-delivered water | 3.39M L/day |
| Current active adult water carriers | 19,960 |
| Project rostered labor, all priced departments (inclusive) | 100,455 |
| Test 1 labor, ex-farmer numerator (F24) | 54,105 |
| Ex-farmer share of non-farm male labor pool (CONCURRENT / STANDING, MR-08) | 61.6% (2.5x the 25% single-project ceiling) |
| Same share, ROSTERED / STANDING; dimensionally mixed, pre-v0.81 basis, retained as a transparency line | 70.4% |
| Inclusive share of pool; TRANSPARENCY LINE, NOT THE CLAIM. Prices annual-yield farmers against the non-farm pool, which is methodologically invalid double jeopardy (F24); the headline is the 61.6% ex-farmer share above | 130.8% |
| Feedback-solved food ceiling, Waves 3-6 reconciliation OPEN | ~1,603,797 people (100.2% of 1.6M); the off-site basis predates Waves 3-6, so this is not a reconciled figure; headline stays lower-bound |
| ShapingSetting_33 diagnostic population (integrated, Wave 1) | 1,173 people |
| Gate 4b deck-edge drop during transfer (F29, GraniteAswan_42!B48) | 0.41 m = 4.10x the 0.10 m tolerance; identical for end- and side-loading |
| Gate 4b break-even waterplane (F29, SensitivityBreakEven_06!B22) | 3,200 m2 = 246 m hull; largest attested vessel 1,323 m2 (GraniteAswan_42!B54) still 2.42x over |
| Gate 3 break-even lifting footprint, Giza delivery end (F28, SensitivityBreakEven_06!B11) | 5.33 m2 vs 1.5 m2 assumed; finding holds below this; no claim made about the Aswan loading end (MR-03) |
| All-streams timber demand, felled basis, 20-yr build (F27, TimberLabor_40!B7) | 82,609.5 m3 = 30.09x the cedar comparator; ~1,204 shiploads |
| TimberSystem_31 20-year gross timber screen; DIAGNOSTIC, STRUCTURAL STREAM ONLY, not the all-streams total above | 13,343.7 m3 |
| RampSystem_32 diagnostic population (integrated, Wave 4) | 1,118 people |
| RampSystem_32 total material handled over build | 1,062,500 m3 / 1,912,500 t |
| DiagnosticIntegration_35 status | Roll-up added; diagnostics are not additive headline totals |
| Concurrent standing force, ex-farmer (F24/F25) | 47,342 (12.3% of the prime-age cohort) |
| Annual intake of additional prime-age men | 2,705/yr = 12.3% of every maturing male cohort |
| Cumulative distinct men, 20-yr / 30-yr build | 54,105 / 81,158 |
| Project vs Weni maximum levy, CONCURRENT basis (MR-09) | 0.95x at DEFAULT mortality; mobilization at levy scale, held continuously vs raised once |
| Same comparison, rostered / concurrent; dimensionally mixed, transparency only | 1.08x |
| Project vs Weni, CONCURRENT, live band over cemetery range 30-35 | 0.825x to 1.140x; straddles the comparator; scale is unconditional |
| Same band, rostered basis; dimensionally mixed, transparency only | 0.825x to 1.520x |
Appendix B. References and Evidence Status
The following publications support the sources cited in this paper. Workbook sheets SourceRegister_01 and CitationControl_34 preserve the more detailed page pins, confidence badges, assumption labels, and open verification tasks.
- Abdel-Motelib, A., et al. 2012. "Study of the Archaeometallurgical Remains at Bir Nasib, Sinai." Metalla 19(1/2).
- Butzer, Karl W. 1976. Early Hydraulic Civilization in Egypt: A Study in Cultural Ecology. Chicago: University of Chicago Press. See page 83, table 4.
- Hemeda, Sayed, and Alghreeb Sonbol. 2020. "Sustainability Problems of the Giza Pyramids." Heritage Science 8:8. https://doi.org/10.1186/s40494-020-0356-9.
- Lehner, Mark. 2002. "The Pyramid Age Settlement of the Southern Mount at Giza." Journal of the American Research Center in Egypt 39:27-74. https://doi.org/10.2307/40001149.
- Lehner, Mark. 2015. "Labor and the Pyramids: The Heit el-Ghurab Workers Town at Giza." In Labor in the Ancient World, 397-522.
- Lehner, Mark. 2020. "Lake Khufu: On the Waterfront at Giza." In Profane Landscapes, Sacred Spaces, 191-292. Equinox.
- Lehner, Mark. 2020. "Merer and the Sphinx." In Guardian of Ancient Egypt II, 895-925.
- Lichtheim, Miriam. 2006. "The Autobiography of Weni." In Ancient Egyptian Literature, Volume I: The Old and Middle Kingdoms, 18-22. Berkeley and Los Angeles: University of California Press.
- Redding, Richard W. 2013. "A Tale of Two Sites: Old Kingdom Subsistence Economy and the Infrastructure of Pyramid Construction." In Archaeozoology of the Near East X, 307-322. Peeters.
- Rosell Roig, Vicente Luis. 2026. "A Computational Framework for Evaluating an Edge-Integrated, Multi-Ramp Construction Model of the Great Pyramid of Giza." npj Heritage Science 14:142. https://doi.org/10.1038/s40494-026-02405-x.
- Sarry El-Din, A. M. 2003. "Skeletal Remains from the Workers' Cemetery at Giza." In Egyptology at the Dawn of the Twenty-First Century, volume 2, 397-404.
- Scheuring, Simon Andreas. 2025. "Construction of the Great Pyramid with Pulley-Like Systems Using Counter-Weights on Sliding-Ramps." npj Heritage Science 13:473. https://doi.org/10.1038/s40494-025-02018-w.
- Sheisha, Hader, et al. 2022. "Nile Waterscapes Facilitated the Construction of the Giza Pyramids During the 3rd Millennium BCE." Proceedings of the National Academy of Sciences 119(37):e2202530119. https://doi.org/10.1073/pnas.2202530119.
- Tallet, Pierre. 2017. Les papyrus de la mer Rouge I: Le Journal de Merer. MIFAO 136.
- Tallet, Pierre, and Mark Lehner. 2022. The Red Sea Scrolls: How Ancient Papyri Reveal the Secrets of the Pyramids.
- viroroi-pub and viroroi. 2026. viroroi-pub/Egypt: Integrated Edge-Ramp 1.0.14. Version v1.0.14. Zenodo. https://doi.org/10.5281/zenodo.20615955.
- Wilkinson, Toby A. H. 2000. Royal Annals of Ancient Egypt: The Palermo Stone and Its Associated Fragments. London: Kegan Paul. See pages 141-145.
- Younes, Gamal, et al. 2024. "The Pyramid Builders' Waterways: Reconstructing the Ancient Topography of Khufu's Pharaonic Harbour at Giza, Egypt." Journal of Archaeological Science: Reports 53:104303. https://doi.org/10.1016/j.jasrep.2023.104303.
Evidence Status and Open Source Controls
The following notes identify the principal evidence qualifications and remaining source-control work. An open source task does not convert an assumption into a sourced value and does not suspend an otherwise independent finding.
Current population comparator source in workbook: Karl W. Butzer, Early Hydraulic Civilization in Egypt (University of Chicago Press, 1976), p. 83, Table 4, 2500 B.C. row: 1.6 million (sight-verified 2026-07-11 against the open-access ISAC/Oriental Institute edition). Butzer's own table title is "Hypothetical demographic development in ancient Egypt," and the register quotes that framing: the model treats the figure as a stress-test denominator, not a census. Sensitivity runs at 2.0 and 2.5 million are available in the workbook and are more favorable to the conventional scenario.
v0.64 source-hardening pass (all sight-checks cleared 2026-07-11): Merer operational metrics pinned to Tallet, Les papyrus de la mer Rouge I (MIFAO 136, 2017); phyle and gang structure pp. 15-17 with log validation pp. 40-41; transport cadence pp. 23-25; load estimation pp. 25-26; English secondary Tallet & Lehner, The Red Sea Scrolls (2022); harbor geography Lehner, "Merer and the Sphinx," Guardian of Ancient Egypt II (2020), pp. 895-925. Lake Khufu pinned to Lehner, "Lake Khufu: On the Waterfront at Giza," in Profane Landscapes, Sacred Spaces (Equinox, 2020), pp. 191-292, open access, independently corroborated by Sheisha et al., PNAS 119 (2022), and Younes et al., Journal of Archaeological Science: Reports 53 (2024), article 104303. Bir Nasib pinned to Abdel-Motelib et al., Metalla 19.1/2 (2012) for the ~100,000 t slag mass and the ~5,000 t metallic calculation that the authors attribute to Bachmann; the article does not identify the calculation's primary publication. The OK-era caveat is recorded. Redding pinned to Archaeozoology of the Near East X (Peeters, 2013), pp. 307-322. Worker-town capacity re-badged ASSUMPTION (generous) against Lehner 2002 (JARCE 39:27-74) and Lehner 2015 (Labor in the Ancient World, pp. 397-522).
v0.65 source-hardening pass: the Snefru cedar comparator (SRC-PALERMO-CEDAR) is page-pinned to Wilkinson, Royal Annals of Ancient Egypt: The Palermo Stone and its Associated Fragments (Kegan Paul, 2000), pp. 141-145, and the register row is split by badge. The ship count of 40 is SOURCED to those pages. The per-ship volume (~68.6 m3, ~2,745 m3 total) is an ASSUMPTION and is set deliberately generous-high, because a larger comparator volume shrinks the demand ratios and favors the conventional scenario. The row remains a comparator and source-control line only: it does not establish project availability and does not eliminate the procurement burden.
v0.66 provenance pass: the working-age, physically fit male cohort share is registered for the first time as SRC-MALE-COHORT in SourceRegister_01 and CitationControl_34. This 24% lever sets the Test 1 denominator and the demographic-closure basis. It is a demographic synthesis drawn from model life tables for high-mortality agrarian populations, not a single-source citation, and it is recorded as such. Badge ASSUMPTION, taken high in the conventional scenario's favor. Confidence MEDIUM. Status OPEN, pending hardening to a published model life table or an Old Kingdom demographic estimate. Until v0.66 this was the only load-bearing lever in the model carrying no provenance entry of any kind; that gap is now closed and visible. The published sensitivity range of 20% to 30% is unchanged.
v0.92 provenance pass: the worker-cemetery mortality source is sight-verified to Sarry El-Din (2003), "Skeletal Remains from the Workers' Cemetery at Giza," in Egyptology at the Dawn of the Twenty-First Century, volume 2, pages 397-404. The 30-35 male age-at-death range is confirmed in the Hawass worker-cemetery report. SourceRegister_01 also separately records the 900 m harbor-basin carry distance, the 1:1 Sinai expedition-overhead cap, the 40-day leave and festival planning value, the 8% sick/injury absence floor, and workforce entry at age 15 as assumptions or concessions rather than sourced measurements. These provenance repairs change no formula or reported value.
IER source records: Rosell Roig, V. L. (2026). A computational framework for evaluating an edge-integrated, multi-ramp construction model of the Great Pyramid of Giza. npj Heritage Science 14:142, DOI 10.1038/s40494-026-02405-x. Software and accompanying data: Zenodo DOI 10.5281/zenodo.20615955; GitHub viroroi-pub/Egypt, v1.0.14. The records are pinned to the cited journal article and version-specific software and data release and are recorded as SRC-ROSELLROIG-IER and SRC-IER-DATASET in CitationControl_34.
| Source lane | Current use |
|---|---|
| Butzer / Old Kingdom population comparator | Provides 1.6M denominator for population-share stress testing; PAGE-PINNED to p. 83, Table 4, sight-verified (v0.64). |
| AERA / Heit el-Ghurab | Worker settlement and provisioning context; capacity ceiling re-badged ASSUMPTION (generous) with publications pinned (v0.64). |
| PBS NOVA / Lehner-Hawass workforce context | Published workforce-scale comparison. |
| Redding / A Tale of Two Sites | Old Kingdom production-consumption model, PINNED (ANE X, Peeters 2013, pp. 307-322); author concludes labor, not land, was the limiting factor. |
| Boserup / agrarian surplus logic | General support for testing large diverted-output burdens against surplus, seasonality, and labor availability. |
| Internal model-control rules | Material balance, required-function audit, annual-yield farmer roster correction, capacity bands, citation control, and diagnostic-integration readiness. |
| Weni autobiography (Lichtheim AEL I) | Maximum documented OK mobilization comparator (SRC-WENI-LEVY); read at maximum to favor the conventional account; Lichtheim page verification remains open. |
| Palermo Stone, Snefru registers | Expeditionary character of the OK military; temporary levies, no standing army (SRC-PALERMO-SNEFRU); register/page verification remains open. |
| CitationControl_34 | Maintains source-control and page/table verification tasks. |
| DiagnosticIntegration_35 | Maintains integration-readiness status for diagnostic modules and prevents additive misuse. |
Appendix C. Version History Since v0.2
| Workbook version | Major addition | White-paper treatment |
|---|---|---|
| Paper v3.9 (wp39) | Scenario-receipt verification, v0.92 reconciliation, and publication edit | Added the public model's scenario-receipt method, including the reproducible scenario_digest, separate whole-file checksum, canonical-content exclusions, provenance limits, and planned Zenodo baseline receipt. Reconciled the paper to controlling workbook v0.92. Applied an American-English consistency pass, retaining tonne and waterplane and standardizing rope yard; corrected the national-closure multiple to 2.5 times; clarified the cumulative-roster overstatement and MR-21 derivative; consolidated the material-balance discussion; converted the repeated findings section into a concise register; replaced the draft-task section with limitations and remaining work; formalized the reference list; and reordered the version history. No workbook value or reported finding changed. |
| Paper v3.8 (wp38) | IER ramp-timber footnote correction | Corrected a footnote in the IER ramp-timber section that mis-stated the article's archived dataset release as v1.0.10 (it is v1.0.12) and described the v1.0.14 deposit's 12/6/3 channel counts as differing from the article's 16/8/4/2/1 ramp schedule. The two are the same schedule counted as ascending lanes and as total ramps. No reported figure is affected. |
| Paper v3.6 (wp36) | Reconciled to workbook v0.89; counting-basis and settlement-ceiling rulings | Rebuilt from v3.5 against QA_Integrated_Model_v0_89_USER_SOURCE.xlsx (SHA-256 2f45dc46...). 111 mechanical figure corrections applied across 15 sections, 10 traced corrections resolved, and prose-derived figures re-computed from the corrected inputs. Headline restated: M3 533,234 (33.33% of the 1.6M kingdom); on-site rostered roster 47,316; implied village 281,643; settlement overshoot 11.27x; Test 1 61.6% (2.5x the 25% ceiling); inclusive transparency 130.8%; rostered/standing transparency 70.4%; Weni 0.95x concurrent at DEFAULT with a live band of 0.825x-1.140x that now straddles the comparator; cumulative distinct men 54,105 over 20 years and 81,158 over 30; annual intake 2,705. Copper restated at 67.9 kg/day and 24.78 t/yr against a 3.40 t circulating inventory; the Bir Nasib multiple holds at 7.16x. Food headline 45,282 grain farmers, 226,410 with dependents; the feedback-solved ceiling moves to 1,603,797, or 100.2% of the sourced anchor, so the loop, if closed, consumes the whole kingdom. Three substantive changes beyond figures. MR-21: the counting basis is stated as a concession; per-person daily rates are applied to cumulative-roster populations, so the reported burden is an overestimate running in the conventional account's favor, and every verdict survives re-basing. MR-22: the v3.4 claim that a smaller settlement ceiling only worsens the M2 failure is withdrawn; the ceiling cancels, the ratio reduces to on-site roster / 4,200, and a smaller ceiling lowers the reported burden; the overshoot is restated as the workforce ratio it is. The v3.5 withdrawal of exceptionlessness at the sourced 1.6M anchor is itself withdrawn: ClosureSensitivity_45!B36 reports zero cells below the benchmark and the finding holds without exception, its extreme corner returning 28.2%. Two workbook defects found and scheduled for v0.90 rather than followed here: ClosureSensitivity_45!A39 cites 2.5M cells (E30/E31) for the 2.0M stress test, whose true sub-benchmark cells are F22 = 24.2% and F23 = 22.5%; and Findings_09!B4 is labeled four priced departments against six on-site rows. Entries below this row are frozen as historical statements of what each past build reported and were not restated. |
| Paper v3.5 | Population basis, granite scope, and verdict language | No new model content beyond v0.83-v0.85. Every population figure is restated on the corrected concurrent basis: M3 378,746 (23.67%), village 194,875, settlement 7.8x, active water carriers 14,264, Test 1 50.3% (2.0x the benchmark). The Weni finding is restated: 0.77x at DEFAULT and 0.71x-0.82x across the cemetery band, entirely below the comparator, so F25 now reads roughly three-quarters of the largest documented levy held continuously rather than at its scale. The sensitivity-grid claim of exceptionlessness at the sourced anchor is withdrawn and replaced with the DEFAULT-lever result and the count of clearing corners. Copper is restated at 7.16x on the quarry-only scope, and the 8.12x sentence is withdrawn as double-counting. Section 10.1 now distinguishes the 30-piece heavy-load capability subset from the full 8,000-tonne Aswan granite mass-transport burden and states the unpriced and excluded components. |
| Paper v3.4 | Reporting structure: material findings promoted | No model change. Finalized after a second external review pass: the second Executive Summary table is retitled to state that these findings are not expressed by the M3 population total rather than that they sit wholly outside M3, since parts of their labor chains are integrated; water, food, and settlement capacity are added to the integrated table; the independence claim is restated as separately governing fronts that share upstream resources but not a population denominator; timber delivery is promoted to its own subsection at 10.2; findings are presented in numeric order F24 to F31 with finding statements on all of them; F30 leads with the sourced first-rate comparator rather than the assumption-based Chatham one; F31 leads with the Bir Nasib comparison and the woodland footprint is stated as a consequence; the shaping/setting copper-tool diagnostic (1.3797 t/yr) is stated as excluded from the copper finding, which lowers the reported multiple from 8.12x to 7.16x; and the version chronology is moved out of the opening status table. Draft v3.4 restructures reporting after consistent reviewer feedback that the labor and demographic findings were being read as the audit's primary subject with the other modules present only to support them. The Executive Summary's single table headed "Primary finding (labor)" is replaced by two tables at equal level; findings integrated into M3, and findings quantified outside M3; followed by the failure register that states which findings a demographic rescue can and cannot touch. Sections 7.9 Rope and Fiber and 7.10 Copper and Tools are added, presenting chains that were previously visible only in the workbook; findings F30 and F31 are numbered for them. Section 7.8 is reduced to quarrying and route capacity, with route capacity stated as identified and unpriced. Peak-load operations and the wood-fuel ledger are promoted out of the kingdom-capacity section into a new Section 10, so the largest material block in the paper no longer sits under a demographic heading; sections 10 through 15 shift by one. The M-tier ladder carries a scope note stating that it measures labor and settlement integration only. No figure changed; the understatement corrected here was by omission, not by hedging. |
| v0.92 | Publication-text and provenance alignment | Text-only release over v0.91. Replaced the undefined Ep 2 shorthand with conventional baseline, closed the Rosell Roig schedule/version issue under MR-23, strengthened source-register provenance, and corrected QA descriptions of timber and ramp integration. No formula or reported value moved. |
| v0.91 | WP37 text and provenance alignment | Text-only release over v0.90. No reported value moved. The paper names the v0.91 controlling workbook and its full SHA-256, and all current-context version language is reconciled to this release. |
| v0.90 | Register closures and publication-text repairs | Closed the two workbook defects identified during wp36 review and completed text and register corrections. No reported headline value moved. |
| v0.89 | Reporting-basis and settlement-ceiling corrections | MR-21 removed stale numeric language from the Weni verdict note; MR-22 withdrew the claim that lowering the 25,000 settlement ceiling worsens M2 and restated the overshoot as the invariant workforce ratio. The source-anchor grid returns zero cells below the benchmark. |
| v0.88 | MR-19 roster-basis restoration | Restored all terms of the integrated population ledger to one dimensionally consistent rostered basis. The parallel concurrent ledger was retained for transparency. The correction restored the published population architecture rather than changing the underlying people represented. |
| v0.87 | Integration and dimensional-control repair | Removed diagnostic double counts and corrected standing-versus-cumulative basis mismatches exposed during the engine migration. The changes repaired the integration ledger; they did not create new operating burdens. |
| v0.86 | Source split and ruling-register completion | Split the Aswan-corridor distance source from the Merer operational source under MR-16 and recorded outstanding v0.85 rulings in the methods register. Merer remains the source for phyle size, gang structure, cadence, documented boat load, and navigable-season treatment. |
| v0.85 | Aswan granite mass-transport burden; verdict conformance | Total Aswan granite of 8,000 t (Hemeda & Sonbol 2020, SOURCED at Medium) registered; the 30 x 80 t module is now the HEAVY-LOAD SUBSET within it, with the reconciliation visible; 8,000 = 2,400 subset + 5,600 remaining, the remainder a floor because the subset is priced at design maximum. Throughput for the full mass is priced on the sourced Merer schedule at GraniteAswan_42 rows 57-82: at one design-mass piece per voyage; 100 voyages against 30, 3.79 fleet-seasons against 1.14, 182,019 crew-days, 182 t grain; the finding is more operating seasons on the same fleet rather than more concurrent crews. Payload denominator corrected before integration: an initial build divided granite by the laden hull mass at BargeTimber_43!B9 (101.2 t, which includes rigging, crew and provisions) and returned 80 voyages; the cargo denominator is the 80 t design piece. The 1,601 heavy-beam crew is not scaled by mass. Quarry extraction, haul and load/unload of the remaining mass are UNPRICED (no granite-specific rate); shaping, fitting and setting are EXCLUDED (no component geometry); both conservative and stated. Ruling MR-14. Weni verdict strings gain a below-0.9 tier and now read 0.77x at DEFAULT on the propagated concurrent basis; the sensitivity-grid verdict and QAChecks_08 B121 are re-scoped to the DEFAULT-lever cell at the sourced anchor, since two extreme corners cleared on the corrected basis and exceptionlessness was never the claim. The mortality-band mirror is brought onto the concurrent basis (rows 70, 72, 86, 109) and its drift guard passes; the band reads 0.71x-0.82x. |
| v0.84 | Four verified corrections against existing rulings | MR-12: MR-08 propagated into the population architecture; a concurrent multiplier (Model_04!B115, coverage only) and a concurrent on-site ledger (F116:G122) sit beside the cumulative-distinct ledger; village population B123 and the water-feedback solution read the concurrent figures, removing a 20-year mortality flow from a single-moment population and from the daily water coefficient. The 5.95 settlement ratio is unchanged. MR-13: Model_04!B48 is quarry-only, matching its label and Exclusions_11; the shaping/setting crew is removed from the quarry copper-user count so the separate shaping copper diagnostic is no longer double-charged, and the 7.76x Bir Nasib multiple becomes 7.16x. WoodFuelCredit_44!B8 converts its two volume streams at 0.7 t/m3 before adding the tonne-based barge stream. VillageSufficiency_39!B8:B10 read the computed sanitation, medical and cleaning headcounts instead of a service rate and two blanks; container labor is stated as unquantified. ShapingSetting_33 stale publication text is brought into line with the v0.49 Wave 1 ruling. Headline effect: active water carriers 19,960 to 14,264; on-site concurrent roster 32,739; village population 194,875; settlement 7.80x; M3 378,746 (23.67% of 1.6M); Test 1 50.3%; Weni 0.77x. All four raised by external review. |
| v0.83 | Household-factor repair (MR-11) | Inputs_03!B87 "People fed per worker" was wired to Assumptions_02!E40 "Sled length"; identical at DEFAULT 4, divergent at STEELMAN 3.5; so a sledge dimension silently drove family size, food demand, sanitation burden and the national population result through 22 consumers in 9 sheets. B87 is now a literal 4, relabeled "Dependents per project worker", note retained. Twenty-one consumers computing a worker-plus-dependent population now take (1+B87); VillageSufficiency_39!B19 keeps B87 alone because it wants dependents. Off-site population rose from 201,383 to 251,033 and M3 from 483,769 to 533,419 at that release, because off-site workers had been excluded from the population they belong to. No assumption row added, no lever introduced, Inputs_03!B49 not activated. Raised by external review. |
| v0.82 | Integration-status reconciliation | Raised by external review of white paper draft v3.4. DiagnosticIntegration_35 carried statuses that contradicted the wave assignments and, in one case, itself: ShapingSetting_33 was marked NOT READY in column H while column I read YES and the module sheet read INTEGRATED INTO M2/M3. Statuses are now stated per module, and a PARTIAL tier is added because a two-way ready/not-ready split could not express a module with integrated labor and an unintegrated material chain. Findings_09 F14 and F16 keep their historical statements and gain a dated status-update clause. Two count cells move; no burden, roster, feedback loop, M3 component or verdict changed. |
| v0.81 | External-review corrections and propagation | Five value changes, three new rulings, verdicts unchanged. MR-08 puts Test 1 on a dimensionally consistent basis: the rostered numerator embedded a twenty-year mortality flow and was divided by a single-moment standing pool. Concurrent-over-standing and cumulative-over-cumulative return the identical share, so the correction is unambiguous rather than a preference; Test 1 moves from 70.5% to 50.3% against an unchanged 25% benchmark, and the mixed pairing is retained as a transparency line. MR-09 fires the Weni verdict on the concurrent basis only, since Weni levied once; the finding is restated as mobilization at the scale of the maximum documented levy held continuously, rather than categorically exceeding it. MR-10 separates Snefru-ship equivalents of total timber throughput from the literal imported-cedar requirement, which the imported-share lever puts at 30.09 shiploads a year, below the record annually, and 15.05 times the record over the build. A tension between the 50% native share and the stated premise that Egypt lacks structural softwood is recorded rather than resolved, as open task SRC-TIMBER-USECLASS. Gate 4 refloat conformed from the asserted 90 t to the solved 218 t per MR-04, which had been outstanding since v0.73. The 25% ceiling is retained as a comparative benchmark and the requirement is also stated directly as a break-even. A conjunction block records that the failures are simultaneous and that a demographic rescue touches only the labor findings. This draft, v3.3, is published alongside v0.81 and ReadMe_00 B77 moves with it. A second review pass then found the MR-08 correction had not been propagated: ClosureSensitivity_45 still computed the whole grid on the superseded rostered numerator. It then read the concurrent figure; the 1.6M extreme corner became 28.2%, and two 2.0M corners fell below the benchmark at 24.2% and 22.6%; the population blocks are relabeled to the boxed-canyon treatment, QAChecks_08 B121 tests the sourced anchor only, the Weni mortality-band commentary is restated on the concurrent basis at 0.825x-1.140x, and Findings_09, ReadMe_00 and the MR-04 status are brought current. |
| v0.80 | Publication of white paper draft v3.2 | No model content changed. ReadMe_00 B77 moved from v3.0 to v3.2 on publication of this draft, which is the only event that moves it. |
| v0.79 | Comparator basis fix and two disclosures | Value-neutral at DEFAULT; raised by external review before the shipload figures were bound to a public interactive. TimberLabor_40 B31 had derived the forty-ship record as comparator volume divided by the per-ship lever, locking the two: lowering per-ship volume raised the model's own record to 54.9 ships, and the headline multiple reduced algebraically to total demand over comparator volume; invariant to the lever, so a slider bound to it would have moved nothing. Ruling MR-06 makes the ship count the sourced quantity (Inputs_03 B203 = 40), leaves per-ship volume as the assumption lever, and derives comparator volume as count x volume; 40 x 68.625 = 2,745, so nothing moves at DEFAULT. A pure-sink steelman mirror at TimberLabor_40 rows 35-43 records that at 2.0x plank service life the annual requirement falls below the record (34.96 shiploads, 0.87x) while the build-long requirement stands (699.1 shiploads, 17.48x). WoodFuelCredit_44 rows 29-30 state that mortar and gypsum firing fuel is not quantified anywhere in the model, so the managed-woodland figure understates the requirement in the conventional account's favor. |
| v0.78 | Timber delivery equivalence wired live | Zero numeric change to any pre-existing cell. The shipload figures the project has published were derived outside the workbook; TimberLabor_40 rows 25-33 now compute them from B7, with cedar per-ship volume as a Dashboard lever (Inputs_03 B202, Assumptions_02 E103) set generous-high; a lower value raises every count, so the published figures are the conservative end. Annual shiploads (60.19), cumulative (1,203.8), the comparator ship count, and both multiples are live. SensitivityBreakEven_06 rows 26-29 add the delivery break-even: a forty-ship delivery would need 103.26 m3 per ship to cover one year of demand. The rationale is stated on the sheet; Egypt has no structural softwood stand, so procurement is delivery-limited rather than volume-limited and the ship is the operative unit. |
| v0.77 | Publication-reference alignment | No model content changed. ReadMe_00 B77 now names the PUBLISHED white paper draft and states its own scope in the cell: it moves on publication, not on every working revision. That definition is the fix for a recurring failure; the cell went stale across four releases before v0.75 and again immediately after, because it had been tracking whichever draft happened to be current when the workbook last shipped. |
| v0.76 | Granite wording and scope corrections | Zero numeric change; twelve string edits. Two notes had described the Aswan-Giza corridor as a round trip of ~900 km when Inputs_03 B193 (890 km) is each way; corrected to ~900 km each way, ~1,800 km round trip. B193 is unchanged and remains the computational input; prose reports ~900 km because the Nile branch serving Giza ran closer to the complex in the Old Kingdom and the course has shifted, so a to-the-kilometer ancient figure would imply false precision. GraniteAswan_42 E34 no longer implies the expedition corps rides the river corridor: it works the ~5 km overland legs at each end, while the corridor is crewed and priced separately in RiverHarbor_47. The beam basis is now stated consistently as a conservative modeled subset of 30 major granite beams in the 50-80 t class, generous-low against the forty to fifty in the relieving chambers alone. Two objections added: an overland-haul rescue does not remove the shore-to-vessel transfer, only shortens the floating leg; and the 890/900 precision question is answered directly. |
| v0.75 | Cross-reference repair | No model content changed. ReadMe_00 B77 bumped after going stale across four paper releases, and A3, which had named a white paper draft eleven versions old and was never scanned because it sits in prose rather than a labeled field, now points at B77 rather than carrying a version of its own. Three MethodsRulings_48 affected-cell entries stopped citing versioned paper filenames and now cite sections, and a fifth register rule records why: cite sections, not paper versions. |
| v0.74 | Gate 4b corrections following external review | One value change. Restraint friction basis moved from Inputs_03 B166 (0.40, unimproved ground) to B4 (0.30, wet track, badged favorable to the conventional scenario) per ruling MR-05, since the transfer runs across a prepared ramp and a timber deck; restraint falls from 32 t to 24 t per beam, the generous reading, and now closes against the stated push force. The attested hull comparator promoted from prose to levers (Inputs_03 B200/B201) with waterplane, deck-edge drop and tolerance multiple computed live at GraniteAswan_42 rows 54-56, so no figure on the granite explainer is a hardcode. |
| v0.73 | Gate 4b transfer stability | Zero numeric change to any pre-existing cell. GraniteAswan_42 rows 44-53 price the deck-edge drop at the loading edge as 4W/A: parallel sinkage plus the trim or heel contribution, which is 0.410 m on the modeled 60 x 13 m hull against a generous 0.10 m tolerance, 4.10 times over. End-loading and side-loading derive to the same value, so no choice of loading method escapes it; verified against a numerical hydrostatic solve with no small-angle assumption, agreeing within 0.32%. SensitivityBreakEven_06 rows 20-24 carry the break-even: holding the loading edge within tolerance needs 3,200 m2 of waterplane, or 246 m of hull at the modeled beam. Ruling MR-04 anchors the block to BargeTimber_43 B12 (218.0 t solved) rather than Inputs_03 B168 (90 t asserted); on the latter basis the identity understates by 233%. A three-tier validity guard reports the band. Gate 4 rows 27-29 still read B168 and are NOT YET CONFORMED. |
| v0.72 | Gate 3 rescoped to the Giza delivery end (MR-03) | Zero numeric change; scope and description only. Aswan sits at the First Cataract, where granite bedrock underlies the city and extends along the eastern bank at the quarry and the floodplain is almost nonexistent, so soft saturated alluvium does not describe the loading end. The bearing-pressure test and its break-even now apply at Giza, where the beam is transferred off the barge onto floodplain and harbor-basin ground. The Aswan-end position is stated affirmatively rather than dropped: the burden there is unchanged in kind, and proposed load-at-grade routes are recorded as the open pricing task SRC-GRANITE-LOADING-PROPOSALS. |
| v0.71 | Gate 3 break-even and hardcode promotion | Zero numeric change to any pre-existing cell. SensitivityBreakEven_06 gains the granite shore-transfer line: the lifting footprint at which bearing pressure meets the assumed capacity is 5.33 m2 against a 1.5 m2 working assumption, a factor of 3.56, or 44% of the beam's own bearing face; so the Gate 3 finding is stated as a threshold rather than an assumption. GraniteAswan_42 B23 promoted from a hardcoded 15,000 literal to Inputs_03 B194 via Assumptions_02 E95, and B20's hardcoded beam face promoted to B195/B196. B23 badge corrected from SOURCE to ASSUMPTION; defensible and generous, but carrying no register entry; and SRC-BANK-BEARING registered (Low, OPEN). |
| v0.70 | MR-07 conformance: timber comparator basis | One formula change, one value change, six string changes; verified by headless recalculation and a full cell diff across 44,219 cells with a 10-point headline gate at zero failures. IERRampTimber_38 B32 repointed from B26 (installed volume) to B30 (felled volume), moving the ramp-planking cedar ratio from 9.74x to 25.23x and matching TimberSystem_31 B40, which was already on the felled basis. The comparator counts raw cedar as it arrived, so the numerator must be raw timber as it must arrive; log against log. Both comparator row labels rewritten to state their volume basis. SRC-CEDAR-PROCESSING-STATE registered (Low, OPEN), recording that the Palermo entry specifies ships of cedar wood without stating processing state; badged UNATTESTED, not disproven. Earlier drafts reporting 9.7x and, at the 5,000-pass setting, roughly four times are superseded. |
| v0.69 | MethodsRulings_48 register (not promoted) | Tier-0 documentation working file, folded into v0.70 rather than released. Added MethodsRulings_48 as a pure-sink register of closed methodology questions with a plain-language timber-chain preamble and worked loss-stack example; seeded MR-01 (ground-haul 500 m lever retained) and MR-07 (timber comparator basis). Zero value changes. |
| v0.68 | Badge and provenance hardening | No headline value and no verdict change; verified by LibreOffice headless recalculation of v0.67 and v0.68 and a full cell-by-cell diff; 1 formula change, 1 calculated-value change and 31 static text changes outside the new content, across 43,912 compared cells, plus a 22-point headline regression gate with zero failures. Seven inputs re-badged off SOURCED where the note recorded engineering judgment, a planning value or an unverified attribution: metabolic efficiency, mechanical work per man-day, desert water need, rest days, leave and festival days, Chatham ropemakers, and the block-mass point selection (the 2.5-3 t range remains sourced; only the choice of the high end is a judgment). Median male age at death re-badged DERIVED as the midpoint of the sourced 30-35 Giza worker-cemetery range, with the replacement-multiplier floor at age 35 disclosed on the input and a LIVE MIRRORED mortality-band sensitivity block added at DemographicClosure_46 rows 44-123: the 61-cell dependency chain from the mortality input to the verdict cells is duplicated with live formulas at each endpoint of the sourced range, a third column mirrors the chain at the live lever as a drift guard, and that guard is surfaced in the check panel at QAChecks_08 row 122. The block is a pure sink and feeds nothing. Vertical lift re-badged CONTROL: a full-workbook scan confirmed no formula consumes it, and the plateau climb is priced through the ramp/incline effort multiplier B51, which is not derived from the 40 m figure. Village capacity relabeled to disclose its dual role as excavated-capacity comparator and numerator of the village-population ratio, so that raising it raises implied M3 rather than relieving it. Rope project lifecycle wired from a hardcoded 30 years to the build-duration lever B81, moving a terminal display cell from 17,016.9 t to 11,344.6 t. SRC-MORTALITY and SRC-ROPE-CHATHAM confidence lowered to Medium with explicit pin tasks. |
| v0.67 | Check-and-report layer repair | No burden, roster, feedback-loop, M3 component or verdict change; verified by LibreOffice headless recalculation of v0.66 and v0.67 and a full cell-by-cell diff; 2 formula changes, 2 calculated-value changes and 4 static text changes across 43,434 compared cells, plus a 16-point headline regression gate with zero failures. QAChecks_08 B121 had tested ClosureSensitivity_45 B35, the global grid minimum at the 2.5M / 30% cohort / 65% farm corner; a cell this paper states openly falls below the ceiling; so the check could never pass and reported FAIL against a correct grid. It is rebuilt as a COUNTIF pair over the defensible range (B9:F14 at 1.6M and B18:F23 at 2.0M) against the live ceiling lever B5, and reports PASS; the 2.5M NK-era block is excluded by design and the exclusion is recorded in the row note. Findings_09 F6 had read Model_04 B51 / Inputs_03 B67, dividing annual copper demand by the smelt-and-charcoal labor coefficient, leaving it insensitive to the Bir Nasib comparator itself; it is repointed to Model_04 B65, moving the sheet from 7.46x to 7.16x and aligning it with SensitivityBreakEven_06 B10 and with this paper. Both checks were wrong; neither model was. |
| v0.66 | Male-cohort terminology and provenance repair | No formula, value, or verdict changes; verified by LibreOffice headless recalculation of v0.65 and v0.66 and a full cell-by-cell diff; 0 value differences and 0 formula differences across 43,434 compared cells, 62 string cells changed. The sex-neutral "able-bodied" labels are replaced with the prime-age male cohort and the non-farm male labor pool across Assumptions_02, Inputs_03, NationalClosure_41, ClosureSensitivity_45, CitationControl_34 and ReadMe_00, matching the male scope of the Test 1 numerator per the ruling of 2026-07-10 (DemographicClosure_46 E6). The 24% cohort lever is registered as SRC-MALE-COHORT, confidence MEDIUM, status OPEN. The adversarial-tests table adds the women-in-the-denominator objection. Sensitivity range 20-30% preserved exactly. |
| v0.65 | Register close-out, check repair, ceiling lever wiring | No headline value changes; both verdicts unchanged. Palermo cedar comparator page-pinned to Wilkinson (2000) pp. 141-145 and badge-split: ship count SOURCED, per-ship volume ASSUMPTION (generous-high). QAChecks_08 reconciliation of the M3 total corrected to read Model_04 D133 and RiverHarbor_47 B29; the check had been summing the wrong rows and reporting FAIL against a correct M3; the check was wrong, not the model, and it now reconciles to 483,768.86 and reports PASS. NationalClosure_41 B14 and B26 rewired from a hardcoded 0.25 to ClosureSensitivity_45 B5, so the 25% mobilization ceiling drives the verdict text as a live lever; verified by moved-ceiling test, and by a full recalculated cell diff showing zero value changes at DEFAULT. |
| v0.64 | Source hardening (register-only) | No model value changes; verdicts unchanged by construction. Load-bearing rows page-pinned, all sight-checks cleared 2026-07-11: Butzer p. 83 Table 4 (1.6M at 2500 BC); Merer MIFAO 136 pp. 15-17/23-26/40-41; Lake Khufu Equinox 2020 pp. 191-292; Redding ANE X pp. 307-322; Bir Nasib Metalla 2012 + Bachmann ~5,000 t with OK-era caveat (generous as used); worker-town 25,000 re-badged ASSUMPTION (generous; smaller ceiling worsens M2). CitationControl_34 public-release source blocker downgraded. |
| v0.63 | RiverHarbor_47 integrated (Wave 6, F26) | River/harbor corridor priced bodies-only, no families: barge crews 557 + harbor gangs 140 + pilotage 46 = 743 rostered, Merer-anchored (SRC-MERER, Tallet 2017); new 890 km corridor lever. Schedule feasible on paper (~1.14 barge-seasons for 30 pieces); the burden is the standing organization. Headline M3 378,746 (23.67% of the 1.6M kingdom); ex-farmer Test 1 share 70.5% (2.8x the 25% ceiling); inclusive transparency 100.3%; demographic closure 0.77x/1.08x the Weni maximum. Army-sourcing objection pre-answered (Objections row 21). Both verdicts unchanged: does not close. |
| v0.62 | Hardening levers: imported labor, plank reuse | Two levers added, both DEFAULT-neutral to the headline. Imported-labor share (DEFAULT 0; the conventional account assigns the workforce to Egypt): moving it shifts only the pool draw; food, water, housing, and population burdens are nationality-invariant. Plank service-life multiplier (STEELMAN 2.0x flip/downgrade): propagates through TimberLabor_40 into M3; at the steelman setting the ~26,700 m3 planking stream halves and the conventional scenario is granted 714 rostered timber men in full. Objections rows 19-20 pre-answered. Verdicts unchanged. |
| v0.61 | DemographicClosure_46 (F25) | Demographic closure test added as a verdict layer, no M3 change. Standing extraction 12.2% of the prime-age cohort; annual intake one-eighth of every maturing male cohort; sustained mobilization 0.93x/1.07x (concurrent/rostered) the Weni maximum documented levy, read at its most generous. New lever: Weni comparator reading (DEFAULT 50,000). Sources SRC-WENI-LEVY, SRC-PALERMO-SNEFRU. Verdict: DOES NOT CLOSE; SUSTAINED MOBILIZATION EXCEEDS MAXIMUM DOCUMENTED CAPACITY. |
| v0.60 | Test 1 numerator ruling (F24) | Annual-yield farmers (46,350 rostered) were excluded from the Test 1 numerator; their burden is priced in Test 2, removing the double-jeopardy objection. Ex-farmer share 69.5% vs the 25% ceiling (2.8x); inclusive 129.9% retained as transparency line. ClosureSensitivity_45 rebuilt on the ex-farmer numerator. Verdict: DOES NOT CLOSE; MOBILIZATION CEILING EXCEEDED. |
| v0.59 | Tab reorder | Sheet order rationalized for review flow. No model change; all live values identical to v0.58. |
| v0.58 | Granite integrated (Wave 5); barge-timber feed | Aswan expedition enters M3 bodies-only (2,783 rostered); barge felled acacia feeds TimberLabor_40 felling/sawing/overhead. Headline M3 483,026; inclusive non-farm labor share 129.9%. Verdict unchanged: does not close. |
| v0.57 | Ramp-parameter repair | Restored overwritten ramp parameters and corrected the associated ramp-labor inflation; headline M3 revised from 531,793 to 480,231. Verdict unchanged: does not close. |
| v0.56 | DiagnosticIntegration_35 | Added roll-up and integration-decision matrix for open diagnostic modules. |
| v0.55 | WoodFuelCredit_44 | Unified timber waste stack across all streams; timber waste credited to fuel, capped; net woodland reported (Section 10.3). |
| v0.54 | Ramp integrated (Wave 4) | Ramp construction/maintenance/removal moved from diagnostic into M3 using the conventional model’s own required structure. |
| v0.53 | BargeTimber_43 | Granite barge displacement sizing and acacia hull timber (Section 10). |
| v0.52 | GraniteAswan_42 | Aswan granite transition-chain diagnostic; capability gaps priced as physical requirements (Section 10). |
| v0.51 | NationalClosure_41 | National closure test: originally titled "able-bodied labor" and agricultural-surplus ceilings (Section 9.1); retitled to male labor in v0.66. Verdict: does not close. Seasonal-corvee rebuttal addressed. |
| v0.50 | TimberLabor_40 | Wave 3: structural + IER ramp timber (m3/yr) converted to felling, sawing, cedar-shipping, and haul labor; integrated into M3 off-site. |
| v0.49 | ShapingSetting_33 integrated; VillageSufficiency_39 | Wave 1: shaping/fitting/setting enters M2/M3 and the copper chain. Wave 2: village-internal support tested for sufficiency rather than stacked; derived village multiplier published alongside the conventional-baseline floor. |
| v0.48 | IERRampTimber_38 | Sourced-chassis audit of the IER model on author-published data (Section 7.13); control-only. |
| v0.47 | Integrity repair + survivable QA | Fourteen corrupted formulas rebuilt in anchor-routed style; canary tripwire added for round-trip detection. |
| v0.46 | ModelAnchors_36, CompatibilityControl_37 | Anchor-layer references, basis-tag governance, and Excel/Numbers round-trip integrity rules. |
| v0.44 | RampSystem_32 expanded diagnostic | Added ramp material, traffic, maintenance, and removal/rework screens. |
| v0.43 | TimberSystem_31 quantified stock/replacement diagnostic | Added structural timber stock, replacement, gross timber, and service-life screens. |
| v0.42 | ShapingSetting readiness gate | Marked shaping/setting diagnostic not M3-ready and listed integration requirements. |
| v0.41 | ShapingSetting_33 quantified diagnostic | Quantified shaping/setting/casing/rework exposure while holding it outside M3. |
| v0.40 | CitationControl_34 | Added source-control/citation-governance sheet and load-bearing citation gap tracking. |
| v0.39 | Mobilization-capacity bands | Replaced single-cutoff framing with capacity-band framework. |
| v0.38 | Agricultural roster correction and ShapingSetting_33 scope gate | Corrected annual-yield grain/fiber farmer roster factor to 1.0; added shaping/setting control. |
| v0.37 | QA repair after formula-error debris | Repaired corruption/check formulas and restored core QA checks. |
| v0.36 | RampSystem_32 | Adds ramp construction, maintenance, traffic, phasing, and removal/rework control. |
| v0.35 | TimberSystem_31 | Adds structural timber dependency and fuel/structural double-spend control. |
| v0.34 | ProcessingFuelContainers_30 | Adds processing, fuel-handling, container circulation, reserve, and replacement diagnostic. |
| v0.33 | SanitationMedical_29 | Adds first-order sanitation, waste, cleaning, and basic medical diagnostic. |
| v0.32 | FoodFeedback_28 | Originally exposed agricultural/farmer-household feedback as fail/open under then-current assumptions. |
| v0.31 | WaterInfrastructureAlternatives_27 | Replacement-system gate for water-delivery alternatives. |